Iran record heat
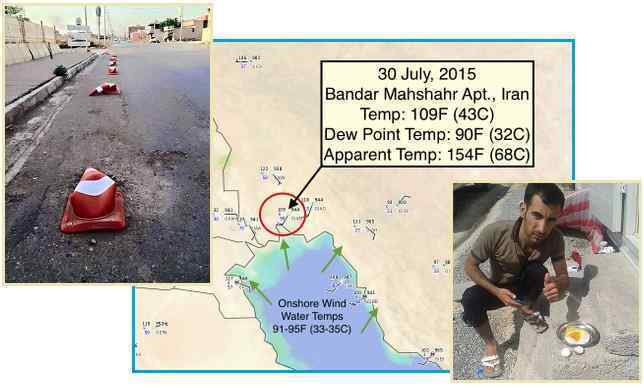
Lately the weather has gone wild. There was a heatwave in Pakistan and now there is a heatwave in Iran. "The city of Bandar Mahshahr, Iran has reached an incredible 163 F (73 C) (Temp: 109F (43C) Dew Point: 90F (32C))." And this maps below shows the temperatures on August 4, 2 meters above the ground. Could the Zetas say something about this, as it seems like a change in the wobble or some kind of tilt.? [and from another] http://strangesounds.org/2015/08/iran-is-literally-melting-amazing-... People can cook their eggs under the sun. [and from another] http://www.telegraph.co.uk/news/worldnews/middleeast/iran/11777843/... The word "hot" has taken on an entirely new meaning in Iran's city of Bandar Mahshahr, where it was claimed that the city's heat index, or "feels-like temperature", was among the highest ever recorded. It is just a few degrees lower than the highest ever recorded heat index, which was 178F (81C) in Dhahran, Saudi Arabia on July 8, 2003. Scorching heat levels of 50C have already paralysed nearby Iraq, where officials were forced to call a four day public holiday because it was too hot to work. The heat index was recorded by a group of astonished weather experts who predict the country could be enduring some of the hottest urban temperatures ever endured by mankind. The dome - a type of high pressure ridge that is passing over the region - has exacerbated electricity and water supply issues and makes the scorching heat even more unbearable. Highest ever temperatures: 56.7C at Greenland Ranch, Death Valley, California, USA on July 10 1913 [and from another] http://www.bbc.com/news/world-asia-33236067 As temperatures reached 45C (113F), Pakistan's PM Nawaz Sharif called for emergency measures and the army was deploying to help set up heat stroke centres. There is anger among local residents at the authorities because power cuts have restricted the use of air-conditioning units and fan. Matters have been made worse by the widespread abstention from water during daylight hours during the fasting month of Ramadan. The all-time highest temperature reached in Karachi is 47C, recorded in 1979. Last month, nearly 1,700 people died in a heatwave in neighbouring India. [and from another] http://meteociel.fr/modeles/gfse_3d.php?mode=4&lat=85.29&lo [and from another] http://www.accuweather.com/en/weather-blogs/climatechange/update-on... [and from another] http://www.weather.com/forecast/news/europe-heat-wave-record-highs-... The culprit for this heat wave was an area of high-pressure aloft nosing northeastward from the Iberian peninsula into parts of northern Europe. Under this dome of high pressure aloft, dry, sinking air and generally light winds allowed stifling heat to build. [and from another] http://www.usnews.com/news/science/news/articles/2015/07/20/another... June was warm nearly all over the world, with exceptional heat in Spain, Austria, parts of Asia, Australia and South America. Southern Pakistan had a June heat wave. In May, a heat wave in India claimed more than 2,000 lives and ranked as the fifth deadliest on record. Earth has broken monthly heat records 25 times since the year 2000, but hasn't broken a monthly cold record since 1916. [and from another] http://www.bloomberg.com/news/features/2015-04-17/this-has-been-the... The heat was experienced differently across the world. People in the U.S. and Canadian Northeast had an unusually cool March. But vast swaths of unusually warm weather covered much of the globe, and records were broken from California to Australia.
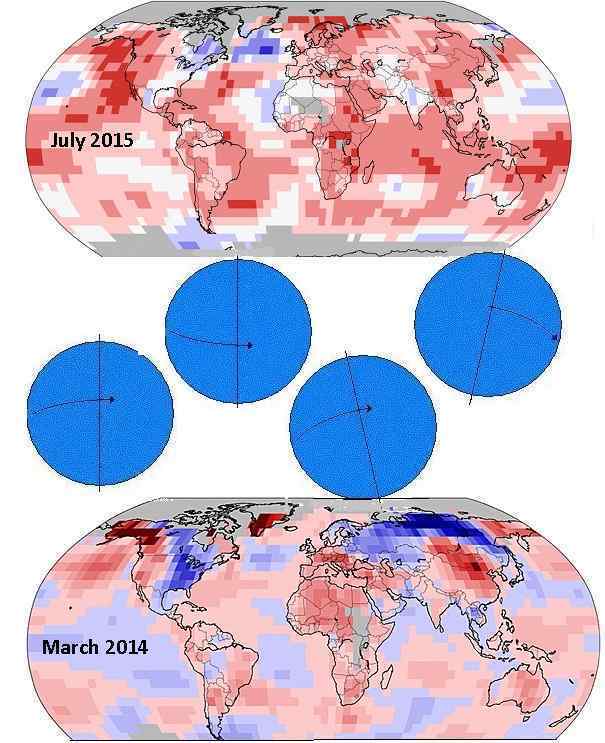
Comparing the heat map from 2014 to 2015, one can see that heat has increased across the globe. These maps are showing the variance from average temps for the time of year, not the temps themselves, thus the fact that the 2014 map was taken in March and the 2015 map in July is irrelevant. The reason so much of the habitable globe - the temperate and tropical zones - are showing this increase overall is due to a change in the Earth wobble. The daily Figure 8 is still in process, but the tilt to one side and then the other have become more extreme, thus laying the habitable parts of the globe under more intense sun for a longer period of time.
The daily Figure 8 of the wobble includes a Polar Push, whereby the magnetic N Pole of the globe is pushed back over the horizon when it rolls around to face Planet X, aka Nibiru. This still occurs, when the Sun is over the Pacific, though because Nibiru is now positioned more to the right of the Earth, this push away occurs when the Sun is overhead at noon closer to N America than previously. This shift due to the position of Nibiru was present in early 2014 for our last Weather Wobble analysis. Comparing 2014 and 2015, we see:
- Tilt to the Right: In 2014 heat increased in China as it was exposed to more sunlight when the magnetic N Pole tilts to the right. This heat increase is still there for China in 2015 and has increased to include the Indian ocean and the ocean to the east of Australia. In 2015 the tilt to the right has become more extreme and thus an Equatorial sun is blasting a larger part of the globe.
- Tilt to the Left: In 2014 heat increased in Europe when it was exposed to more sunlight and was under a high pressure dome when the magnetic N Pole tilted to the left. This is still the situation in 2015.
- Polar Push: In 2014 both Russia and Siberia were registering more cold as the Polar Push had gotten more extreme. Russia and Siberia spend more time with less sunlight, thus. In 2015 this has changed, as the Polar Push has given way to a more extreme tilt to this or that side, which effectively hides the magnetic N Pole of Earth from the blast of magnetons from Nibiru’s N Pole.
- Polar Vortex: In 2014 eastern US and Canada had endured a Polar Vortex winter as this part of the globe is on the opposite side of the globe from Siberia, where the magnetic N Pole now resides. When the Polar Push occurred, noon over the eastern Pacific, N America was pushed under Arctic air. In 2015 this Polar Push had eased, as the tilt to the right and left had increased instead. But cold still flows from the Arctic as the more violent and extreme tilt to the left is pushing Quebec under Arctic air and forcing a daily gush of cold ocean currents around the sides of Greenland.
Views: 1023
Comment
SEARCH PS Ning or Zetatalk
https://poleshift.ning.com/forum/topics/last-trimester-event-timeline
NEW POLE SHIFT UPDATE!
Nancy Lieder November 11, 2025 ZetaTalk Chat for November 30, 2025 - Earth Changes and the Pole Shift
Nancy Lieder, Emissary of the Zetas.
https://poleshift.ning.com/xn/detail/3863141:Comment:1168188
Awakening to the Alien Presence ZetaTalk
The truth will likely never to be known to the public but be washed away in the Nibiru panic soon to engulf the world.
The Worst of the Cover-Up
https://poleshift.ning.com/profiles/blogs/the-worst-of-the-cover-up
Main Establishment Lies
https://poleshift.ning.com/profiles/blogs/main-establishment-lies
Donate
© 2026 Created by Juan F Martinez.
Powered by
![]()
You need to be a member of Earth Changes and the Pole Shift to add comments!
Join Earth Changes and the Pole Shift