Please Place Evidence of the 7 of 10 Plate Movements Here
Kojima had created small snips of Konstantin's animation of the 7 of 10 Plate Movements.
Here is the full 7 of 10 Animation by Konstantin.
This blog is the place to document ongoing earth changes related to the 7 of 10 plate movements as described by the Zetas.
ZetaTalk: 7 of 10 Sequence
written October 16, 2010
The 7 of 10 scenarios describe plate movements, and for this to occur something has to release the deadlock, the current stalemate where the plates are locked against each other. Once the deadlock is broken and the plates start moving, sliding past each other, new points where the plates are locked against each other develop, but these are weaker locks than the one at present. The current lock, as we have so often stated, is the Indo-Australian Plate which is being driven under the Himalayans. This is no small lock, as the height of the Himalayans attests. Nevertheless, the activity in this region shows this likely to be the first of the 7 of 10 scenarios to manifest. Bangladesh is sinking and the Coral Sea is rising, showing the overall tipping of the Indo-Australian Plate. Now Pakistan is sinking and not draining its floods as it should, while Jakarta on the tongue of Indonesia is also sinking rapidly, showing that the tilt that will allow Indonesia to sink has already started.
Meanwhile, S America is showing signs of a roll to the west. Explosions on islands just to the north of the S American Plate occurred recently, on Bonaire and Trinidad-Tobago, and the Andes are regularly being pummeled. There is a relationship. As the Indo-Australia Plate lifts and slides, this allows the Pacific plates to shift west, which allows S America to shift west also. This is greatly increased by the folding of the Mariana Trench and the Philippine Plate. But it is the Indo-Australian Plate that gives way to incite change in these other plates, and this is what is manifesting now to those closely following the changes. Once the folding of the Pacific has occurred, Japan has been destabilized. We are not allowed to give a time frame for any of these plate movements, but would point out that it is not until the North Island of Japan experiences its strong quakes that a tsunami causing sloshing near Victoria occurs. There are clues that the New Madrid will be next.
Where the N American continent is under great stress, it has not slipped because it is held in place on both sides. The Pacific side holds due to subduction friction along the San Andreas, and the Atlantic side holds due to the Atlantic Rift's reluctance to rip open. What changes this dynamic? When S America rolls, almost in step with the folding Pacific, it tears the Atlantic Rift on the southern side. This allows Africa freedom to move and it rolls too, dropping the Mediterranean floor above Algeria. What is holding the N American continent together has thus eased, so that when the Japan adjustments are made, there is less holding the N American continent in place than before, and the New Madrid gives way. We are also not allowed to provide the time frame between the Japan quakes and New Madrid. Other than the relationship in time between the New Madrid and the European tsunami, no time frame can be given. The sequence of events is, thus:
- a tipping Indo-Australia Plate with Indonesia sinking,
- a folding Pacific allowing S America to roll,
- a tearing of the south Atlantic Rift allowing Africa to roll and the floor of the Mediterranean to drop,
- great quakes in Japan followed by the New Madrid adjustment,
- which is followed almost instantly by the tearing of the north Atlantic Rift with consequent European tsunami.
Source: http://www.zetatalk.com/index/zeta584.htm
Tipping Indo-Australia Plate with Indonesia sinking,
http://zetatalk.com/7of10/7of10-23.htm
http://zetatalk.com/7of10/7of10-24.htm
http://zetatalk.com/7of10/7of10-25.htm
http://zetatalk.com/7of10/7of10-26.htm
http://zetatalk.com/7of10/7of10-28.htm
http://zetatalk.com/7of10/7of10-30.htm
http://zetatalk.com/7of10/7of10-31.htm
http://zetatalk.com/7of10/7of10-32.htm
http://zetatalk.com/7of10/7of10-34.htm
http://zetatalk.com/7of10/7of10-37.htm
Folding Pacific
http://zetatalk.com/7of10/7of10-33.htm
http://zetatalk.com/7of10/7of10-38.htm
http://www.zetatalk.com/info/tinfx351.htm
http://zetatalk.com/7of10/7of10-47.htm
South American Roll
http://zetatalk.com/7of10/7of10-39.htm
http://zetatalk.com/7of10/7of10-40.htm
http://zetatalk.com/7of10/7of10-41.htm
http://zetatalk.com/7of10/7of10-42.htm
http://zetatalk.com/7of10/7of10-43.htm
http://zetatalk.com/7of10/7of10-44.htm
http://zetatalk.com/7of10/7of10-45.htm
http://zetatalk.com/7of10/7of10-47.htm
African Roll
http://www.zetatalk.com/7of10/7of10-46.htm
http://zetatalk.com/7of10/7of10-47.htm
http://zetatalk.com/7of10/7of10-48.htm
http://zetatalk.com/7of10/7of10-52.htm
Japan Quakes
http://www.zetatalk.com/7of10/7of10-53.htm
http://zetatalk.com/7of10/7of10-54.htm
New Madrid
http://www.zetatalk.com/7of10/7of10-59.htm
http://www.zetatalk.com/7of10/7of10-60.htm
http://zetatalk.com/7of10/7of10-61.htm
http://www.zetatalk.com/7of10/7of10-62.htm
http://zetatalk.com/7of10/7of10-63.htm
http://zetatalk.com/7of10/7of10-64.htm
http://zetatalk.com/7of10/7of10-65.htm
http://zetatalk.com/7of10/7of10-68.htm
European Tsunami
http://zetatalk.com/7of10/7of10-70.htm
http://zetatalk.com/7of10/7of10-71.htm
http://zetatalk.com/7of10/7of10-72.htm
http://zetatalk.com/7of10/7of10-73.htm
http://zetatalk.com/7of10/7of10-74.htm
Due to the slowing of the 7 of 10 plate movements by the Council of Worlds the impact of some of the events described above will be lessened.
The Zetas explain:
ZetaTalk: Pace Slowed
Written May 19, 2012
The effect of the thousands of humming boxes placed along fault lines and plate borders can be seen in several incidents that have occurred since the start of the 7 of 10 plate movements. The lack of tsunami during the 7 of 10 sinking of the Sunda Plate is one such example. We predicted at the start of the 7 of 10 scenarios in late 2010 that the Sunda Plate sinking would occur within 2-3 weeks, yet it dragged on through 2011. At the time we had predicted tsunami on the Sunda Plate, in general equivalent in height to the loss of elevation for a coastline. None of this occurred due to the slower pace.
The pace of mountain building in S America, where slowed, has still resulted in rumpling up and down the Andes, and stretch zone accidents likewise in lands to the east of the Andes. The shape of S America has clearly changed. Will the islands in the Caribbean be spared? At some point, as with the magnitude 7.9 quake in Acapulco on March 2, 2012 a significant adjustment will need to occur, and this will include depressing the Caribbean Plate so it tilts, sinking the islands and lands on that portion of the plate to the degree predicted. But the S American roll will likely continue to avoid the magnitude 8 quakes we originally predicted in deference to slow rumpling mountain building. The African roll was anticipated to be a silent roll in any case, so the slowed pace would not affect the outcome.
Will the slowed pace prevent the 7 of 10 scenarios for the Northern Hemisphere? Bowing of the N American continent has reached the point of pain, with breaking rock booming from coast to coast, but still there have been no significant quakes in the New Madrid area. Yet this is past due, and cannot be held back indefinitely. What has and will continue to occur for the Northern Hemisphere scenarios are silent quakes for Japan, which has already experienced drastic subduction under the north island of Hokkaido where mountain building is occurring as a rumple rather than a jolt. However, the anticipated New Madrid adjustment cannot be achieved without trauma. But this could potentially occur in steps and stages such that any European tsunami would be significantly lessened.
All rights reserved: ZetaTalk@ZetaTalk.com
Source: http://www.zetatalk.com/7of10/7of10109.htm
ZetaTalk , Written March 10, 2012
What happens when the pace of plate movement is slowed? The likelihood of tsunami is definitely reduced, as can be seen in the sinking on the Sunda Plate. The sinking occurred, and is almost complete, yet the possibility of tsunami we predicted for various regions on the Sunda Plate were avoided. The height and force of a tsunami is directly related to the degree of displacement in the sea floor, and if this happens in steps rather than all at once the displacement will be less for any given step.
This bodes well for the European tsunami. If the Council of Worlds is still imposing a slower pace on the 7 of 10 plate movements, this tsunami will definitely be lessened. The tear in the North Atlantic will be slight, each time. The amount of water pouring into this void will be less, each time. And the rebound toward the UK will likewise be less, each time. But our prediction is the worst case situation, and it also reflects what the Earth changes, unabated, would produce.
But what does a slower pace do to land masses where jolting quakes are expected? Does this reduce the overall magnitude of the quakes anticipated? Large magnitude quakes result when a catch point along plate borders is highly resistant, but snapping of rock finally results. Usually there is one place, the epicenter, where this catch point resides and a long distance along the plate border where smaller quakes have prepared the border for easy movement. A point of resistance within the body of a plate, such as the New Madrid, can likewise resist and suddenly give.
There is no way to lessen the resistance at these catch points, though the tension that accompanies such points can be reduced so that the quake itself is delayed. What this means for a slower 7 of 10 pace is that large magnitude quakes will be spread apart in time, and their relationship to our predictions thus able to be camouflaged by the establishment. Where sinking (such as the Caribbean Island of Trinidad) or spreading apart (such as to the west of the Mississippi River) are to occur, these land changes will eventually arrive. But like the sinking of the Sunda Plate, a slower pace unfortunately allows the cover-up time to maneuver and develop excuses.
All rights reserved: ZetaTalk@ZetaTalk.com
Comment
-
Comment by Stanislav on October 22, 2016 at 6:41pm
-
Mexico stretch zone
Land subsidence in central Mexico detected by ALOS InSAR time-series
Yellow, red ares sinking
Averaged 2006-2011 LOS velocity map of central Mexico, from ALOS InSAR time series analysis. Insets: zoom into the 21 subsiding areas, black diamonds
Similarly in central Mexico, massive groundwater extraction result in land subsidence. We identify land subsidence in 21 areas, including 17 cities. Linear subsidence rates of 30 cm/yr are observed in Mexico City, while in the other locations rates of 5-10 cm/yr are detected.
In Mexico the limits of the subsiding areas are typically characterized by high velocity gradients often coinciding with existing faults, motion on these faults being driven by water extraction rather than by tectonic activity.
Land subsidence directly threaten the protection of multiple sites of the UNESCO World Heritage list and indirectly threaten people lives due to the decrease in the water quality. The integration of InSAR with other monitoring techniques is necessary to mitigate ground failure hazards and improve sustainability of groundwater resources at regional scales.Chaussard, E., Wdowinski, S., Cabral-Cano, E., & Amelung, F. (2014). Land subsidence in central Mexico detected by ALOS InSAR time-series. Remote sensing of environment, 140, 94-106. estellechaussard.com
Why This City of 21 Million People Is Sinking 3 Feet Every Year
5 March, 2016. Mexico City is sinking. Home to 21 million people, who consume nearly 287 billion gallons of water each year, the city has sunk more than 32 feet in the last 60 years because 70 percent of the water people rely on is extracted from the aquifer below the city.
"There's no fixing it," journalist Andrea Noel told producer Alan Sanchez in the video below from Fusion. "Once land is subsided, it's subsided."
The water table is sinking at a rate of 1 meter (3.2 feet) per year. As the city population grows and water demand increases, the problem will only get worse.
"It needs to be stopped because it's too late to be remedied," Noel said. "The city needs to find a way to figure out their water problem. They really need to look into alternatives like collecting rainwater, which makes so much sense in a city like this, which gets so much rainfall every year." Source: ecowatch.com
Mexico city sinking cm/month
Source: esa.int
World
Ring Of Fire Tectonic Plate Is Cooling - And Shrinking
27 August, 2014. The tectonic plate that dominates the Pacific "Ring of Fire" is not as rigid as most assume, and it's getting less fiery. according to researchers at Rice University and the University of Nevada.
Rice geophysicist Richard Gordon and Corne Kreemer, an associate professor at the University of Nevada, Reno, have determined that cooling of the lithosphere -- the outermost layer of Earth -- makes some sections of the Pacific plate contract horizontally at faster rates than others and cause the plate to deform. <...>
A map produced by scientists at the University of Nevada, Reno, and Rice University shows predicted velocities for sectors of the Pacific tectonic plate relative to points near the Pacific-Antarctic ridge, which lies in the South Pacific ocean. The researchers show the Pacific plate is contracting as younger sections of the lithosphere cool. Credit: Corne Kreemer and Richard Gordon
The researchers saw hints of deformation in a metric called plate circuit closure, which describes the relative motions where at least three plates meet. If the plates were rigid, their angular velocities at the triple junction would have a sum of zero. But where the Pacific, Nazca and Cocos plates meet west of the Galapagos Islands, the nonclosure velocity is 14 millimeters a year, enough to suggest that all three plates are deforming.
"When we did our first global model in 1990, we said to ourselves that maybe when we get new data, this issue will go away," Gordon said. "But when we updated our model a few years ago, all the places that didn't have plate circuit closure 20 years ago still didn't have it."
There had to be a reason, and it began to become clear when Gordon and his colleagues looked beneath the seafloor. "It's long been understood that the ocean floor increases in depth with age due to cooling and thermal contraction. But if something cools, it doesn't just cool in one direction. It's going to be at least approximately isotropic. It should shrink the same in all directions, not just vertically," he said. Source: science20.com
As the seas rise, a slow-motion disaster gnaws at America’s shores
4 September, 2014. <...>
In many places, including much of the U.S. Eastern Seaboard, an additional factor makes the problem worse: The land is sinking. This process, known as subsidence, is due in part to inexorable geological shifts
<...> The rise is two to three times greater in spots along the Gulf of Mexico and the Atlantic Ocean because of subsidence, a process whereby natural geological movements and extraction of underground stores of water, oil and gas cause the ground to sink.
<...> About one-third of that rise was from oceans rising globally as water warms and polar ice melts. The remaining two-thirds resulted from land sinking due to subsidence, which happens when the removal of underground water, oil and gas causes the land to pancake.
<...> Around the world, the biggest increases were in Asia, reflecting the greater impact in that region of subsidence, the process by which geological forces and the extraction of groundwater cause the land to sink
<...> Source: reuters.com
The quiet sinking of the world's deltas
More than 500 million people live in the world's river deltas, yet new research shows that these population magnets are under increased pressure from human activity.
<...>
He might well be forced to do that. Deltas – some of the most densely populated areas in the world – are sinking and becoming harder to live on. In Ca Mau, groundwater exploitation and deforestation have eroded the coastline by between 100 and 1400 metres over the past 13 years, according to a recent satellite-based study by Norway’s Geotechnical Institute (NGI) and Vietnam’s Ministry of Agriculture and Rural Development. The land surface has fallen by up to 70 centimetres in places, they found.Many of the world’s deltas are subsiding by 10 cm or so a year – far faster than the 3 mm or so annual rise in sea levels – causing the sea to swallow up dozens of metres of land each year. In the past decade, 85% of the world’s major river deltas experienced severe flooding, killing hundreds of thousands of people. Source: futureearth.org
India
The data taken directly from the plot graphic, as it's long to process data!
India has already moved to Northeast around 1,2 metres since 1994 (960^2+800^2=c^2)
Source: geodesy.unr.edu
Source: unavco.org
Source: serc.carleton.edu
Ganga inundates Sangam
25 June, 2011. <...> Similarly, Jayant Kumar Pati another associate professor of the department said that plate tectonics owing to the fallout by the construction of Tehri Dam. "Our observations show that the course of Ganga is shifting towards the north side of Allahabad i.e. towards the Jhunsi side. As a direct implication, it is more unlikely that the annual phenomena of the inundation of the temple would cease to occur. But things do not remain constant, as far as level of water in any given river in concerned and if it has inundated the temple, there is no reason to get surprised," added Pati.
Sharing his view on the issue, Prof S S Ojha of the department of Geography, AU had also said that because of the Plate Tectonic theory, the western part of India is in the on the rise, while the eastern part (lying towards Bay of Bengal), is getting submerged. As an impact, the gradient of rivers flowing in west-east direction will become steep and vice-versa. Source: timesofindia.indiatimes.com
US to help Bangladesh study earthquake risks
9 December, 2011. <...> Previous studies by Steckler’s team have shown that the region was the site of major temblors and shifts in plates that caused major Himalayan rivers — Brahmaputra, Ganges and Meghna — to shift course suddenly, inundating vast areas.
Rock movements have caused some areas of Bangladesh to sink faster than the others, affecting river course. "If a river is close to switching, then the uplift and subsidence caused by earthquakes may cause it to shift," Steckler said. Source: scidev.net
South Asia landslides 'on the rise'
Earthquakes are one cause of landslips, but there are many others
Most South Asian countries are witnessing an increasing trend in landslides in recent years and scientists say extreme rainfall patterns, seismicity, and uncontrolled human activities are to blame.Authorities have said the number of people killed and displaced and properties destroyed by the disaster are also on the upward trend.
Landslides are common in the region, particularly in the Hindu-Kush-Himalaya foothills, during monsoon that lasts for around four months until September. But, authorities say their frequency and intensity are on the rise.
"There has been an increase in the events of landslides in the region in recent years," says Mriganka Ghattak, a specialist in geological disasters with the South Asian Association for Regional Cooperation (SAARC's) Disaster Management Centre in Delhi.
"We have noticed the rise particularly in northern parts of India, Nepal, Pakistan, Afghanistan and some areas of Bangladesh," said Ghattak.
"Broadly the main affected areas are in the Hindu-Kush-Himalaya (HKH) region where the geological conditions are quite dynamic."
According to the centre, of the total landslides that happened across the globe in 2009, nearly 60% was in South Asia where around 280 people died because of the disaster that year. Source: bbc.comHimalayan 'drop after Nepal quake'
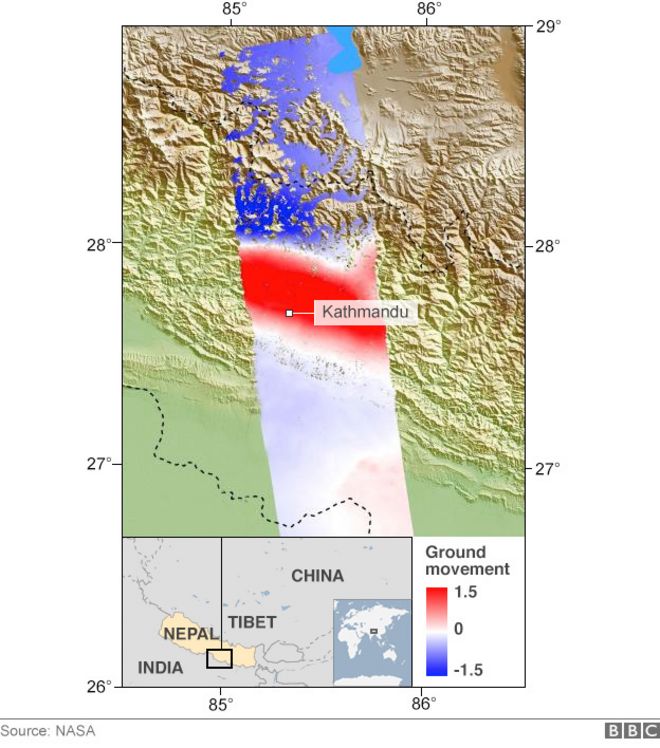
8 May, 2014. The height of a swathe of the Himalayas has dropped by around one metre as a result of the devastating Nepal earthquake, scientists say.
But they add that the drop will roughly be balanced by slow uplift due to tectonic activity.
And they have yet to analyse satellite images of the region in which the most famous Himalayan peak - Everest - is located.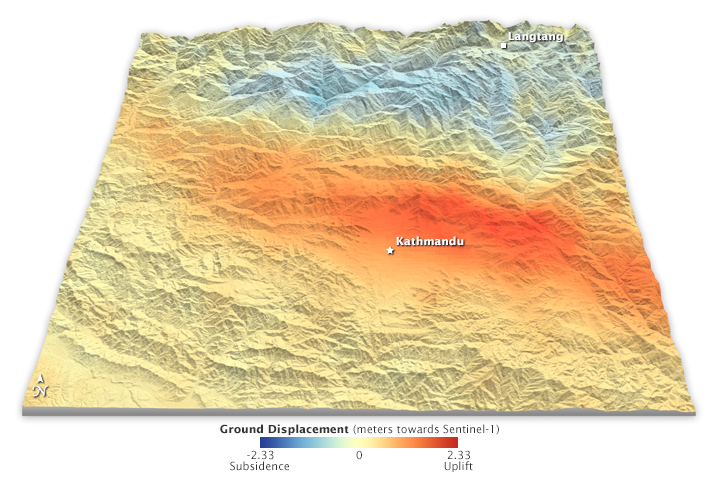 Source: earthobservatory.nasa.gov
However, there continues to be debate over exactly how tall Everest is.
"The primary stretch that had its height dropped is a 80-100km stretch of the Langtang Himal (to the northwest of the capital, Kathmandu)," said Richard Briggs, a research geologist with the United States Geological Survey (USGS).
The Langtang range is the region where many locals and trekkers are still missing, presumed dead, after the avalanches and landslides that were triggered by the 7.8 magnitude earthquake on 25 April.
Scientists believe the height of a handful of other Himalayan peaks, including the Ganesh Himal to the west of the Langtang range, may also have dropped.
The satellite images they have analysed so far have focused on central Nepal, which was the hardest hit by the quake. Everest is to the east of this main shaking zone.
Scientists say whether or not the world's highest peak saw a change in its height by few centimetres will have to be further confirmed by ground survey and GPS or an airborne mission.
"But what we see in the data that we evaluated further away from the plate boundary, to the north of the capital Kathmandu, is a clearly identifiable region with subsidence of up to 1.5m," says Christian Minet, a geologist with the German Aerospace Centre (DLR), which processed the Nepal earthquake data sent by the Sentinel-1a satellite. Source: bbc.com45% of India's coastline facing erosion
12 August, 2015. The Andaman and Nicobar Islands face the most erosion, with close to 89% of the shoreline eaten away by the Bay of Bengal
As much as 45% of India’s 8,414-km long coastline is facing erosion, according to a new study based on satellite data over 15 years, published in the Indian Academy of Science’s journal Current Science.
The study–the most detailed thus far–also reports that close to 19% of the coastline is stable and about 36% is showing accretion, or expansion. The Indian coast has lost a net area of about 73 sq km.
Scientists from Space Application Centre (SAC), Ahmedabad and Central Water Commission, Ministry of Water Resources, compared satellite images from two time periods–1989-91 and 2004-06–to measure the changes to India’s coastline. The Andaman and Nicobar Islands face the most erosion, with close to 89% of the shoreline eaten away by the Bay of Bengal.
Source: business-standard.com
Land subsidence confirmed
18 November, 2012. A spell of heavy rain that followed the Neelam cyclone which resulted in heavy damage to agriculture fields, particularly paddy, has confirmed that exploitation of natural gas has caused land subsidence in the Krishna and Godavari deltas, says a former professor of geology of Andhra University and member of Movement for People Centred Development G. Krishna Rao.
<...>
Coastal area is getting water logged even with a rainfall of 5 cm to 10 cm and for several days. Severity of this situation will increase in the next few years as the land is sinking, Prof. Krishna Rao warned.Sea water is encroaching on the deltas with further sinking of the land and they would turn into wet lands, a stage preceding complete submergence into sea. Source: thehindu.com
-
Comment by Stanislav on October 22, 2016 at 6:39pm
-
China
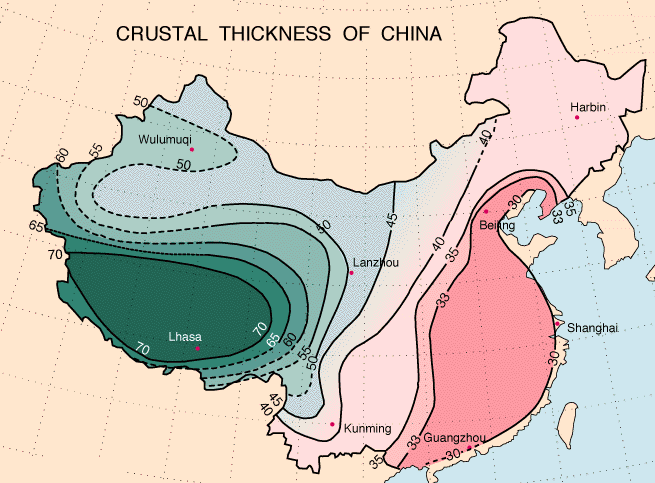
As noted in our explanation of the Hangzhou UFO sighting, which was seen from the airport at Hangzhou and down along the China coastline all the way to the Vietnam Sea, this coastline can anticipate participating in the 7 of 10 sinking of the plate tongue holding Indonesia. This is what is emerging. As we pointed out at that time, these regions were being warned about tsunami and a suddenly rising sea level as the plate tongue holding Indonesia is bent and pulled down. Note the path of the quakes you delineated, and they are along this path that was warned. This area of China is also subject to being bent, as the crust is not as thick as further inland, and as is known is having horrific sinkhole problems.
ZetaTalk Chat Q&A for January 22, 2011
Land subsidence hits 50 cities
21 February, 2012. More than 50 cities in China have wide-spread land subsidence, China Central Television (CCTV) reported Monday.
As large as 79,000 square kilometers of land has dropped more than 200 millimeters, Zhang Zuozhen, vice-president of China Geological Environmental Monitoring Institute, told CCTV.
The subsidence mainly occurs at the Yangtze River Delta, North China and plain areas covering North China's Shanxi province and Northwest China's Shaanxi province, he said.
<...>
In Xi'an, capital of Northwest China's Shaanxi province, more than 1,000 wells have been sealed after 150 square kilometers of land dropped more than 200 millimeters since 1959.
Shanghai, located at the Yangtze River Delta is recharging underground water through 121 wells with more than 60,000 tons every day. Source: chinadaily.com.cnBeijing has fallen: China's capital sinking by 11cm a year, satellite study warns
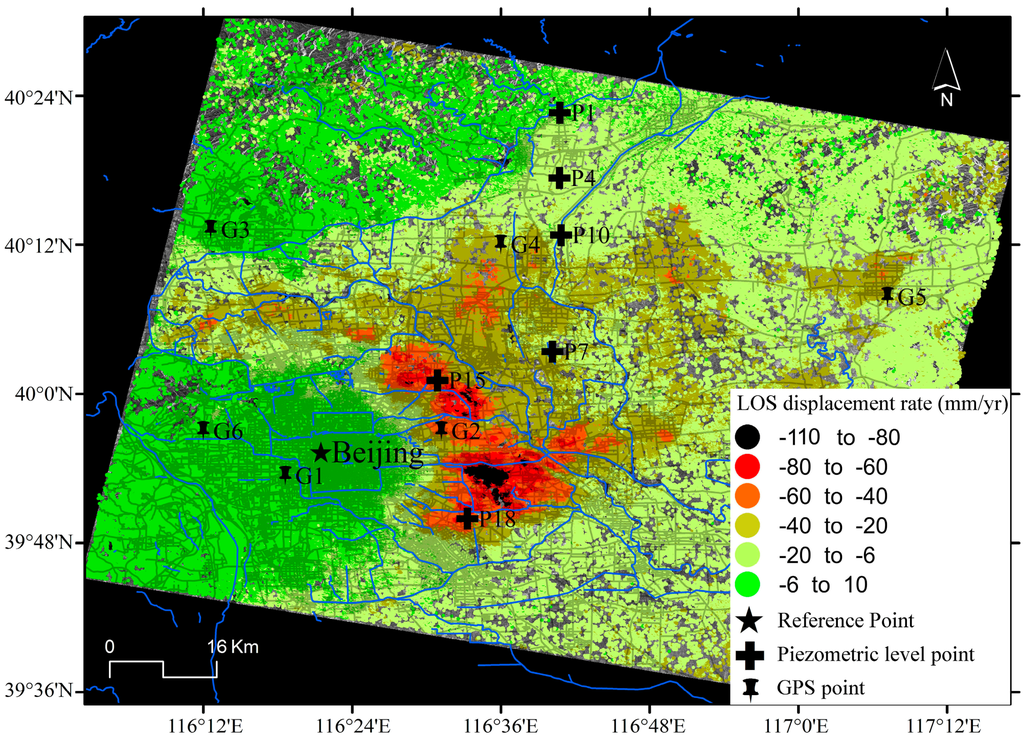
Chen, M.; Tomas, R.; Li, Z.; Motagh, M.; Li, T.; Hu, L.; Gong, H.; Li, X.; Yu, J.; Gong, X. Imaging Land Subsidence Induced by Groundwater Extraction in Beijing (China) Using Satellite Radar Interferometry. Remote Sens. 2016, 8, 468. This is an open access article distributed under the Creative Commons Attribution License (CC BY 4.0). mdpi.com
China’s capital is known for its horrendous smog and occasional sandstorms. Yet one of its major environmental threats lies underground: Beijing is sinking.
Excessive pumping of groundwater is causing the geology under the city to collapse, according to a new study using satellite imagery that reveals parts of Beijing – particularly its central business district – are subsiding each year by as much as 11 centimetres, or more than four inches.
The authors of the study warn that continued subsidence poses a safety threat to the city of more than 2o million, with “a strong impact on train operations” one of the predictions. Source: theguardian.com
Time-varying land subsidence detected by radar altimetry: California, Taiwan and north China
Vertical displacement rates derived from ENVISAT (Jul 2002–Oct 2010) where croplands constitute greater than 50% of land use in the NCP.
Radar altimetry also reveals time-varying subsidence in the North China Plain consistent with the declines of groundwater storage and existing water infrastructure detected by the Gravity Recovery And Climate Experiment (GRACE) satellites, with rates reaching 20 cm yr^1 and cumulative subsidence as much as 155 cm.
The cropland cover is from Global Land Cover (GLC)-SHARE38, beta-release 1.0. Red symbols represent Beijing, Tianjin, Jinan and Shijiazhuang and empty circles represent other major cities. Rates with standard error greater than 5.00?cm yr?1 or with a signal-to-noise ratio <1.50 were rejected. Along-track locations without rates are over foothills, such as eastern Shandong Province. Two regions of major cropland subsidence (greater than 2?cm yr?1) are within the red-lined polygons. Letters A-D show the locations of TP-EN-J2 time series of height changes in Figs S11–14, with the cumulative subsidence values given. GMT36 V5.1.3 is used to plot Fig. 6 (http://gmt.soest.hawaii.edu/).
Vertical displacement rates in the croplands of the North China Plain from (a) TP (Aug 1992 – Jun 2002) and (b) J2 (Jun 2008 – Aug 2014). The cropland cover (shaded areas) is from Global Land Cover (GLC)-SHARE38, beta-release 1.0. GMT36 V5.1.3 (http://gmt.soest.hawaii.edu/) is used to plot the land cover, ground tracks and all the features
Hwang, C., Yang, Y., Kao, R., Han, J., Shum, C. K., Galloway, D. L., ... & Li, F. (2016). Time-varying land subsidence detected by radar altimetry: California, Taiwan and north China. Scientific Reports, 6. This work is licensed under a Creative Commons Attribution 4.0 International License. http://creativecommons.org/licenses/by/4.0/ nature.com
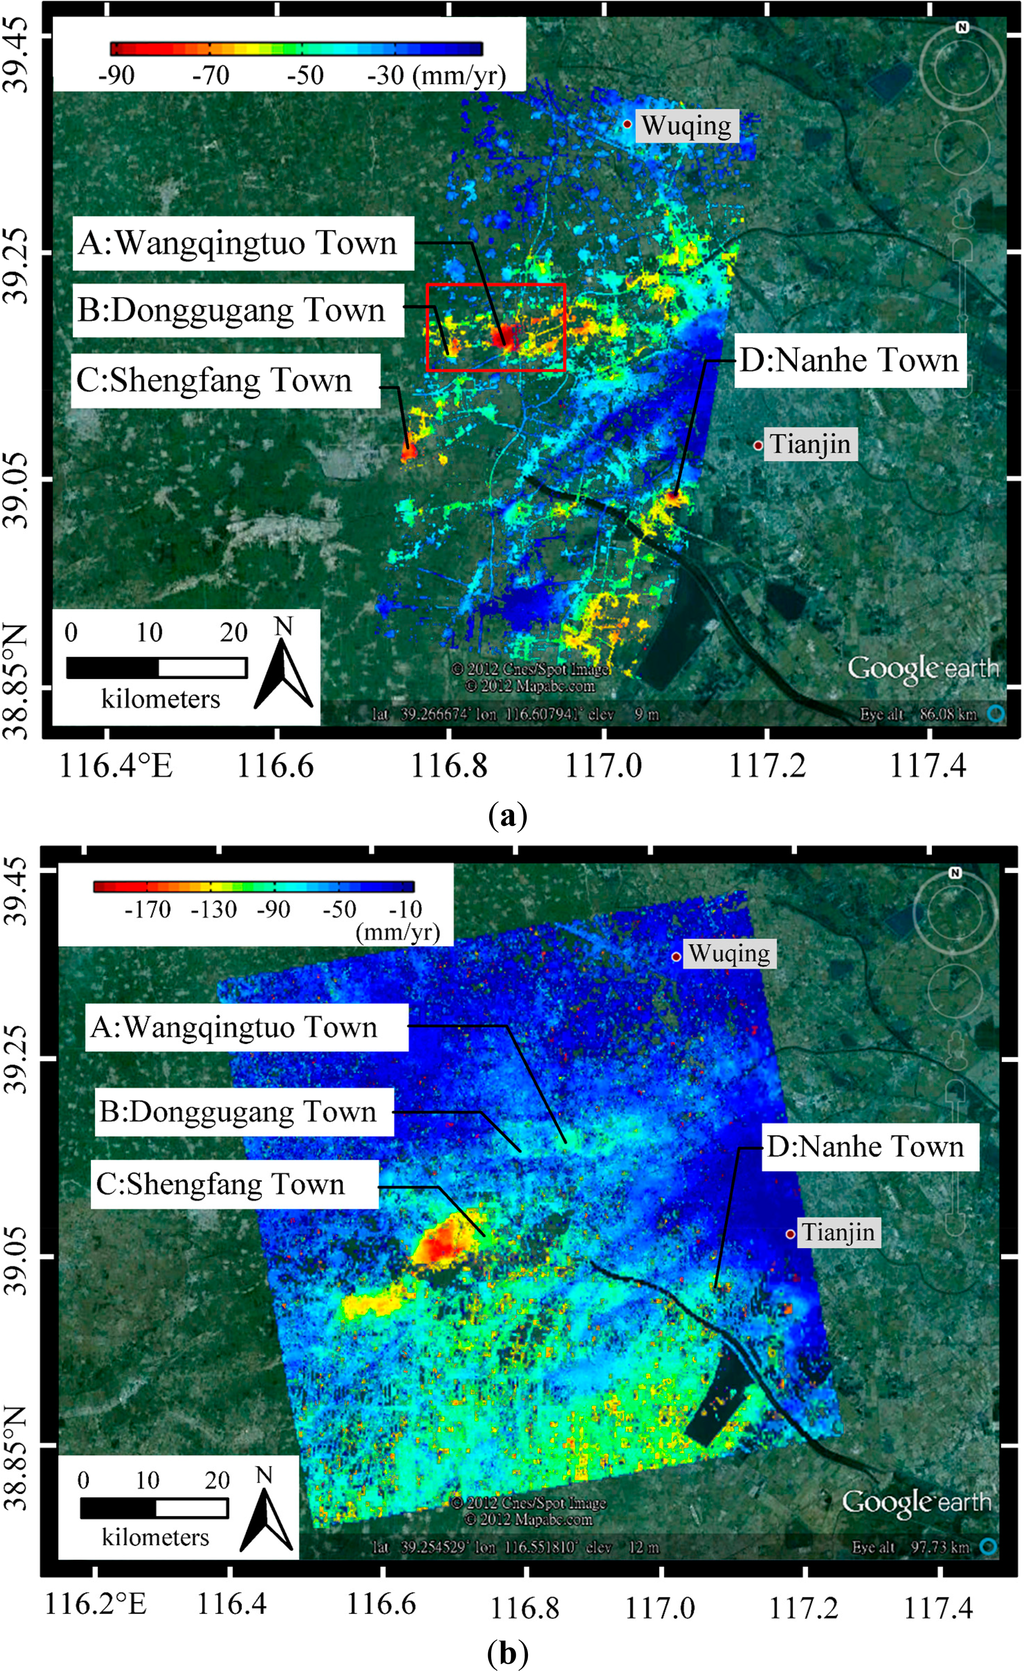
Linear deformation trends along line of sight (LOS) direction. Three major subsiding centers are located in A: Wangqingtuo Town, B: Dongguguang Town, C: Shengfang Town, D: Nanhe Town. (a) Linear deformation trend of TSX using PS analysis. The colorbar ranges from ?90 to ?10 mm/year; (b) Linear deformation trend of ALOS-PALSAR using the QPS technique. The colorbar ranges from ?190 to ?10 mm/year.
Luo, Q.; Perissin, D.; Zhang, Y.; Jia, Y. L- and X-Band Multi-Temporal InSAR Analysis of Tianjin Subsidence. Remote Sens.2014, 6, 7933-7951. This is an open access article distributed under the Creative Commons Attribution License (CC BY 3.0). mdpi.com
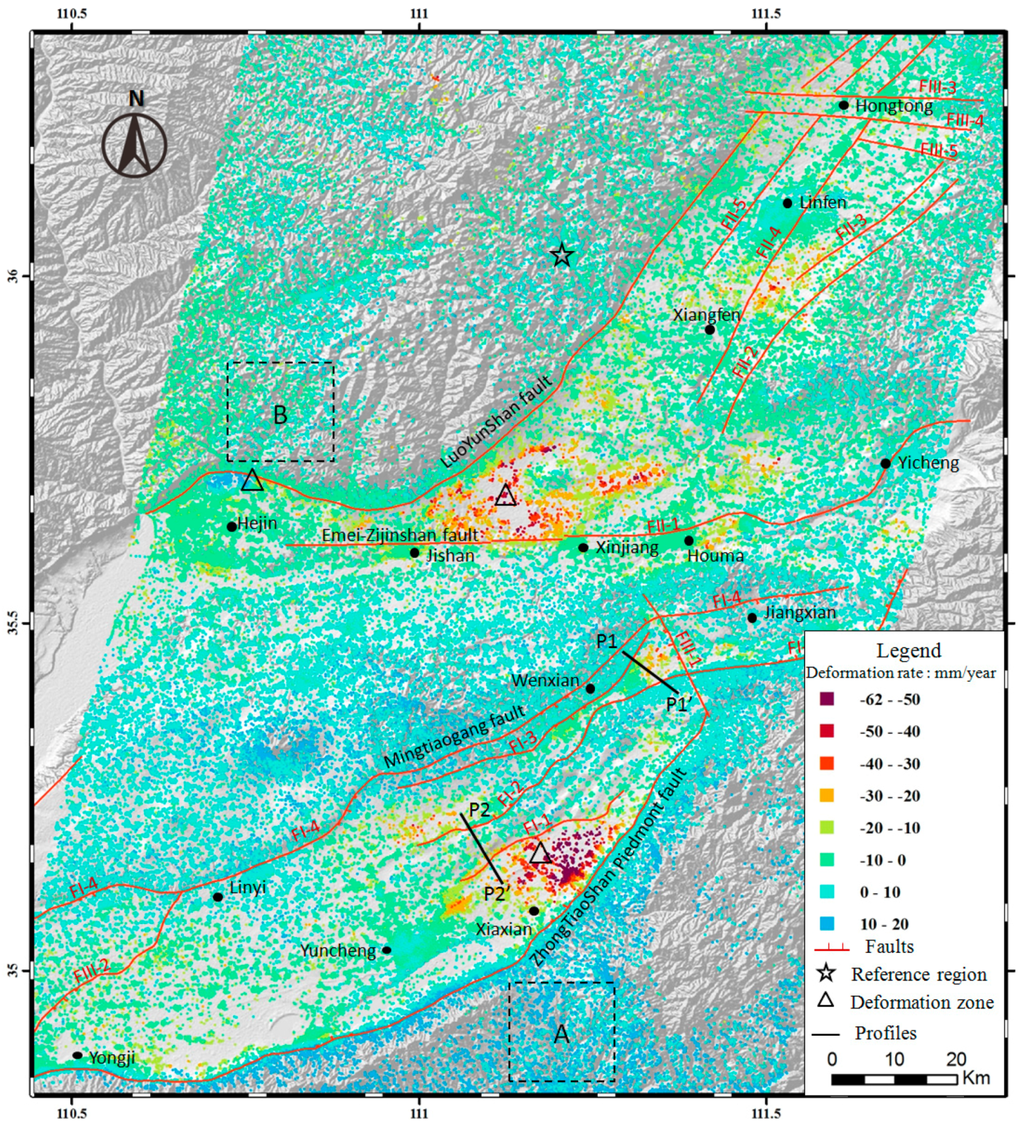
Mean velocity of the Linfen–Yuncheng basin derived from the InSAR time series.
Yang, C.-S.; Zhang, Q.; Xu, Q.; Zhao, C.-Y.; Peng, J.-B.; Ji, L.-Y. Complex Deformation Monitoring over the Linfen–Yuncheng Basin (China) with Time Series InSAR Technology. Remote Sens. 2016, 8, 284. This article is an open access article distributed under the terms and conditions of the Creative Commons by Attribution (CC-BY) license (http://creativecommons.org/licenses/by/4.0/). mdpi.com
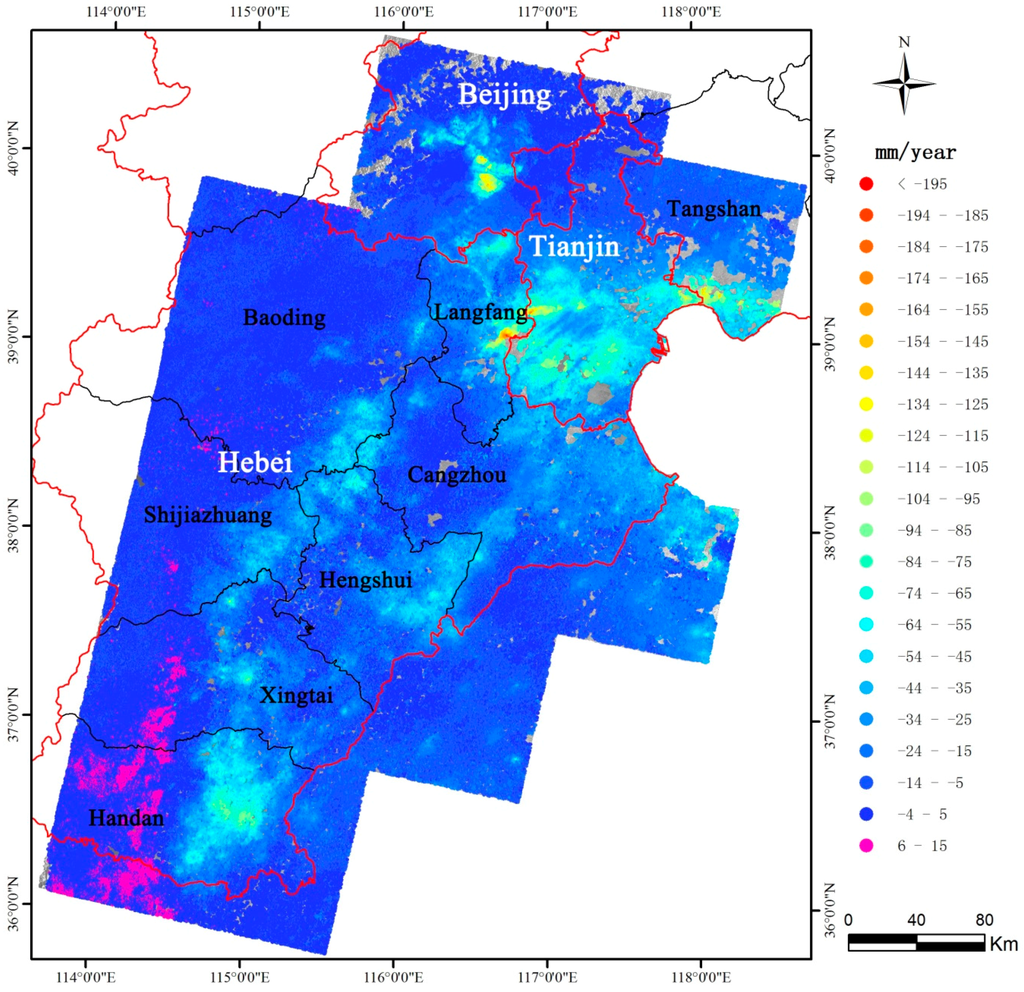
Linear subsidence rate over the Beijing-Tianjin-Hebei region from 2012 to 2014 observed by time series RADARSAT-2 images.
Zhang, Y.; Wu, H.; Kang, Y.; Zhu, C. Ground Subsidence in the Beijing-Tianjin-Hebei Region from 1992 to 2014 Revealed by Multiple SAR Stacks. Remote Sens. 2016, 8, 675. This is an open access article distributed under the Creative Commons Attribution License (CC BY 4.0). mdpi.com
Petar Marinkovic and Yngvar Larsen, (2016). Subsidence of Beijing (China) mapped by Copernicus Sentinel-1 time series interferometry. Zenodo, DOI: 10.5281/zenodo.5767. insarap.org
Sinking North China Plain threatens development
2 November, 2011. Land subsidence, or the downward shift of land, in the North China Plain is not a new problem. Since the 1950s, constant land subsidence has occurred across nearly 70,000 square kilometers there, with some places sinking 3.18 meters and at an annual rate of more than 100 millimeters
Beijing, Tianjin, Tanggu and Cangzhou are the most affected areas – Cangzhou has sunk about 2.4 meters since the 1970s, said Wu Aimin of the Chinese Academy of Geological Environment Monitoring.
<...> As land subsidence increases, so will the economic losses.
In Beijing, the land is sinking at a maximum rate of 137 millimeters a year in economic and cultural boom areas such as Haidian and Chaoyang districts, said Yang Yan, a professor at the Beijing Institute of Technology, in an article.
The impact of land subsidence on buildings, roads and infrastructure in Beijing has become increasingly apparent. Since 2000, one third of Beijing's water pipeline damage was caused by land subsidence. Underground pipelines face the biggest challenge because land subsidence causes the pipelines to bend, deform or even break, while causing gas pipelines to fracture or roads to collapse.
Beijing's subway lines 10 and 13, as well as the Daxing and Yizhuang lines, all run across or near the subsidence area. Land subsidence constitutes to be a potential threat to railroad track. In 2005, a hole 3 meters wide and 2 meters deep formed 20 to 30 meters from a subway station. And in 2009, settlement of 1.85 centimeters near Xidan station affected nearly 40 square kilometers of road surface on Chang'an Avenue. <...> Source: china.org.cn
Subsidence brings down Yangtze River Delta
Shanghai has sunk by nearly 3 metres over the last 80 years, causing damage worth 14.5 billion yuan (US$1.7 billion), according to a report.
The report also shows that 16 provinces and regions in China, and 46 major cities also suffer from subsidence.
<...>The report shows that south of the Yangtze River, the land has sunk by an average of more than 20 centimetres over an area of almost 10,000 square kilometres.
The most serious ground subsidence occurs in the urban districts of Shanghai Municipality and Suzhou, Wuxi and Changzhou in East China's Jiangsu Province, and Jiaxing in Zhejiang Province. Subsidence here can reach 2.63 metres.
Suzhou, Wuxi and Changzhou have lost 2.575 billion yuan (US$310 million) because of subsidence that affects both urban and rural areas.
It causes damage to buildings and problems such as floods on farmland. Source: in.china-embassy.org
Canada earthquakes increase

Figure 1. Alberta earthquake locations from 1985 through 2011, 2013, and 2014. Events prior to 2006 were obtained from Earthquakes Canada.
Figure 2. The total number of earthquakes in Alberta per year from 1965 to present is shown as green histogram bars; earthquakes with a magnitude greater than 2.5 ML are shown with red. The blue line shows the number of seismic stations available for analyzing Alberta earthquakes for a given year.
Figure 3. Earthquake locations that occurred up to 2010, showing the Rocky Mountain House and Brazeau River Clusters.Source: ags.aer.ca
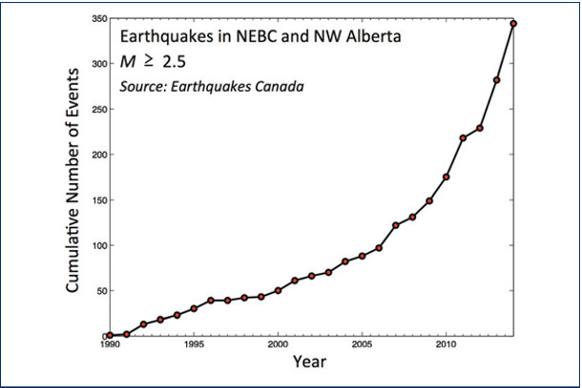
With the advent of hydraulic fracturing in western Canada, the number of reported earthquakes has jumped in northern B.C. and Alberta. Source: thetyee.ca
Japan uplift
Land rising out of the sea in Hokkaido Japan - rose 50 feet (over 1,000 feet long)
25 April, 2015. A massive sudden (1 day) collapse and rise of land has occurred along the coast of Hokkaido Japan.
Major global earthquake activity is taking place, and serious crustal movement is obviously underway in the region around North Japan.
The new land began rising from the sea yesterday morning (April 24, 2015) with just a 1 meter rise (3 feet), then began rising rapidly, the event is still ongoing as of April 25th into 26th 2015. At the same time of the land rising, the area around the rise began to subside.
One area displacing the other.
The new land mass has now risen over 50 feet above the water (near 1,000 feet long), and near 10 meters wide (30 feet)! Not ‘small’ by any means, and a very rare occurrence to top it off. Source: dutchsinse.com
Atlantic stretch and Medditterean sinking
England
During each Pole Shift, each passage with consequent crustal shift, the UK experiences sinking on its western side. Ireland, Scotland, Wales, and even England will experience drastic sinking during this pending passage. That this has happened in the past can be seen by looking under the waves, and seeing ocean bottom that has recently been land, below. England will not only be pulled down, on its western side, it is also obviously being torn in two at the River Humber. The establishment will come up with an excuse, as they always do, for the Earth changes in process, no matter how absurd their excuses become. The Eurasian Plate is being pulled apart, while the Atlantic is spreading apart. Rock layers get torn apart in this process, so the loose ground shifts as the base upon which it lies gives way. This process will continue and accelerate.
ZetaTalk Chat Q&A for February 16, 2013
Estimate of the vertical land motion across the UK derived from a GNSS solution provided by the NERC British Isles continuous GNSS Facility (BIGF). Dots indicate the positions of the GNSS stations that contributed to the solution. The map of vertical land motion is an interpolation from the estimates at these sites.
Tamisiea ME, Hughes CW, Williams SDP, Bingley RM. 2014 Sea level: measuring the bounding surfaces of the ocean. Phil. Trans. R. Soc. A 372: 20130336. http://dx.doi.org/10.1098/rsta.2013.0336. rsta.royalsocietypublishing.org
Published by the Royal Society under the terms of the Creative Commons Attribution License http://creativecommons.org/licenses/by/4.0/, which permits unrestricted use, provided the original author and source are credited.
-
Comment by Stanislav on October 22, 2016 at 6:38pm
-
Netherlands parts sinking
1 June 2016. For a low-lying, densely populated country like the Netherlands, monitoring subsidence is critical. Until recently, tiny displacements in the ground beneath our feet couldn’t be mapped nationally but, thanks to the Sentinel-1 mission, this is now possible.
Focusing on the Netherlands and Denmark, scientists have been using radar images from the Sentinel-1A satellite to pinpoint where the ground is stable, where it is rising and where it is sinking – and, importantly, by exactly how much. Images from November 2014 to April 2016 and 2.5 million measurement points were used to compile the map above, which shows subsidence and uplift in the northeast of the Netherlands. Most of these measurements were made around buildings and constructions such as dikes.
Remarkably, these measurements are accurate to a few millimetres. However, within a couple of years this accuracy will improve further, approaching 1 mm/year over the entire country.
<...> The map at the top shows that some areas, particularly along the western shore of the Ijsselmeer, along the lower causeway that crosses this manmade lake, and some areas close to Groningen in the east, are sinking by as much as 20 mm a year. <...>.
Understanding land deformation is important for investing in renovations. Source: esa.int
Spain parts sinking
The Valley of Guadalentin in Lorca, the deepest in Europe according to research in collaboration with the University of Alicante
Image from: Boni, R., Herrera, G., Meisina, C., Notti, D., Bejar-Pizarro, M., Zucca, F., ... & Fernandez-Merodo, J. A. (2015). Application of multi-sensor advanced DInSAR analysis to severe land subsidence recognition: Alto Guadalentin Basin (Spain).Proceedings of the International Association of Hydrological Sciences, 372, 45. CC Attribution 3.0 License. digital.csic.es
Guadalentin slumps at 100 milimeters per year, raising the risk of economic impact, flooding and infrastructure of the area. <...>
Researcher Roberto Tomas Jover, from the University of Alicante Polytechnic School Department of Civil Engineering warns on the risk for Spain of this land subsidence. <...>
The lifting off the ground, however, leads to other problems. Tomas Jover explains that a ground settlement over 2.5 centimetres is already a problem; another one is the fact of this settlements being irregular>> with the consequent height deviation from one facade to the other on the same building. The aforementioned study analyses the recovery of groundwater that has occurred since 2008 and then determines the cause of the land deformation.
The researcher cites the case of the church of Santa Justa and Rufina in Orihuela as an example, which had to be underpinned>> due to this problem of subsidence.
The research group with Tomas Jover as the main researchers are studying the land subsidence or progressive surface collapse in medium and lower basins of the Segura river. There are many regions affected by land subsidence in Spain, especially in southern and southeastern regions, where water demand is higher that water resources and, therefore, water shortfall is supplied with groundwater. In all cases studied, the most alarming is the Guadalentin valley in Lorca where the largest land subsidence in Europe occurs due to water extraction. In 2015, Tomas Jover and his reserach team have published the article Twenty-year advanced DInSAR analysis of severe land subsidence: the Alto Guadalentin Basin (Spain) case study on the scientific journal Engineering Geology, and they are now working on a Spanish Ministry project on this. Murcia is next with registered values up to 7 millimetres a year <...>
Other case studies being developed by this multidisciplinary team are Orihuela, with values registered of 5 millimeters per year; north of Madrid, where subsidence occurs during periods of extraction, which is almost fully recovered when pumping ceases; and parts of Barcelona, such as El Valles and Santa Perpetua de Mogoda, with maximum rates of 6-10 millimeters per year. Also, this UA expert stresses that they are collaborating with international reserach groups in Leeds, Glasgow, Newcastle (as a result of this collaboration the Beijing work was drafted), Federico II di Napoli, Florencia, Padova, Liverpool, etc., and a good number of national reserach works (Granada, UPV, UPC, UPM, Zaragoza, CSIC, Oviedo, etc.)>>. Source: web.ua.es
Greece parts sinking
Example of wide-area mapping of terrain deformations over mainland Greece. This GPS-calibrated deformation map covers 65 000 sq km – approximately half of the country’s territory. This map was created using 10 individual ERS-1/2 stacks, each stack being a time series of 58 to 76 SAR images acquired from 1992 to 2003 for a total of 671 images. © ZKI/DLR. esa.int
© ZKI/DLR esa.int
In one of its first trials, the WAP identified over a million persistent scatterers over half of Greece’s mainland. In rural areas, there was an average of 10 scatterers per sq km, while urban areas, like Athens, saw up to 200 scatterers per sq km.
Using about 360 gigabytes of raw radar data from the ERS-1 and -2 satellites, the WAP mapped terrain deformation over more than ten years, finding that some areas are sinking by about 10 mm per year.
High subsidence was detected in Athens, Larissa and around the Gulf of Corinth among other places. Both subsidence and uplift were detected in and around the city of Thessaloniki. Source: esa.int
Dead sea sinkholes
Source: haaretz.com
Yemen
[courtesy of J.M. Sholan]
Sana’a Basin Subsidence
- High coherence in the Sana’a city allows us to derive a detailed land deformation evolution from November 2003 to December 2008.
- The subsidence rate within the Sana’a city was approximately 1 cm/year in the radar line-of-sight (LOS) direction between 2003 and 2008.
- The main subsidence was found in the center and southern parts of the city, while deformation in the northern part is less obvious.
- The subsidence rate here was much faster than within the city: it exceeded 14 cm/year. The local water wells have been drying up according to the well data.
- Time evolution of surface deformation and a series of profiles and points reveal spatially and temporally variable aquifer compaction
Mabar Basin Subsidence
- The subsidence rate exceeded 30 cm/year in the agricultural area north of the town of Mabar during 2007 – 2011 according to ALOS PALSAR L-band data.
- The southern part of the Mabar basin also experienced high subsidence rates, although somewhat lower than to the north – 5 cm/year.
- The seasonal fluctuations of ground deformation show that the subsidence rate in summer is faster than in winter.
Two smaller agricultural basins to the west of the Mabar basin experienced subsidence with rates of about 37 cm/year according to ALOS PALSAR amplitude range offset calculations and difference between SRTM and Tandem-X DEMs.
Two smaller agricultural basins to the west of the Mabar basin experienced subsidence with rates of about 37 cm/year according to ALOS PALSAR amplitude range offset calculations and difference between SRTM and Tandem-X DEMs
Abdullin, A., Xu, W., Kosmicki, M., & Jonsson, S. (2015, April). Rapid groundwater-related land subsidence in Yemen observed by multi-temporal InSAR. In EGU General Assembly Conference Abstracts (Vol. 17, p. 13844). presentations.copernicus.org
UAE

Mountains in Masafi 'rise by 4 cm'
The Masafi earthquake on March 10 last year might have caused the mountains of east Ras Al Khaimah to uplift by up to four centimetres, according to geoscientists.
Studies conducted by scientists from the Petroleum Institute in Abu Dhabi and the Japan Oil Development Company showed that the Masafi earthquake had caused the Musandam mountain area of east Ras Al Khaimah to uplift by up to four centimetres while the Musandam peninsula in the Khasab area went down by up to three centimetres, said Dr Karl Berteussen, acting director of Petroleum Geosciences Engineering at the Petroleum Institute. Source: gulfnews.comSouth America Roll
Chilean earthquake moved entire city 10 feet west, shifted other parts of South America
8 March, 2010.
The massive magnitude 8.8 earthquake that struck the west coast of Chile last month moved the entire city of Concepcion at least 10 feet to the west, and shifted other parts of South America as far apart as the Falkland Islands and Fortaleza, Brazil. These preliminary measurements, done by researchers including geophysicists on the ground in Chile, paint a much clearer picture of the power behind this temblor, believed to be the fifth-most-powerful since instruments have been available to measure seismic shifts. unavco.org
This is the preliminary solution obtained by Project CAP (Central and Southern Andes GPS Project) for the coseismic displacement field associated with the recent M 8.8 Maule earthquake in south-central Chile. Peak measured displacement is 3.04 m near the city of Concepcion, Chile. Significant displacements are evident as far east as Buenos Aires, Argentina (2-4 cm) and as far north as the Chilean border with Peru.
The massive magnitude 8.8 earthquake that struck the west coast of Chile last month moved the entire city of Concepcion at least 10 feet to the west, and shifted other parts of South America as far apart as the Falkland Islands and Fortaleza, Brazil.
These preliminary measurements, produced from data gathered by researchers from four universities and several agencies, including geophysicists on the ground in Chile, paint a much clearer picture of the power behind this temblor, believed to be the fifth-most-powerful since instruments have been available to measure seismic shifts.
Buenos Aires, the capital of Argentina and across the continent from the quake's epicenter, moved about 1 inch to the west. And Chile's capital, Santiago, moved about 11 inches to the west-southwest. The cities of Valparaiso and Mendoza, Argentina, northeast of Concepcion, also moved significantly.
The quake's epicenter was in a region of South America that's part of the so-called "ring of fire," an area of major seismic stresses which encircles the Pacific Ocean. All along this line, the tectonic plates on which the continents move press against each other at fault zones.
The February Chilean quake occurred where the Nazca tectonic plate was squeezed under, or "subducted," below the adjacent South American plate. Quakes routinely relieve pent-up geologic pressures in these convergence zones. Source: sciencedaily.com
Venezuela, Bogota
Bogota lose 80 cm, Source: sideshow.jpl.nasa.go
-
Comment by Stanislav on October 22, 2016 at 6:37pm
-
Bangladesh
BanD-AID: Mitigating Bangladesh Delta Coastal Vulnerability Due to Sea-level Ruse, & Integrated Naturak & Social Framework
C.K.Shum (1), Craug Jenkins (1), Monowar Hossain 8, Zahir Khan 8, Jurgen Kusche 2, R.Ahmed 3, V.Ballu 4, A.Bernzen 5, B.Braun 5, S.Calmant 6, J.Chen 1, J. Guo, F. Hossain, M Kuhn, F.Papa, P.Valty, L.Testut, K.H. Tseng, and the rest of the Belmont Forum BanD-AID Project Team belmontforum.org
Rates of subsidence recorded from the literature for the GBM delta and parts of the interior of the basin
Source: S. Brown , R.J. Nicholls (2015) Subsidence and human influences in mega deltas: The case of the Ganges–Brahmaputra–Meghna; (Faculty of Engineering and the Environment, University of Southampton, Highfield, Southampton, SO17 1BJ, United Kingdom; Tyndall Centre for Climate Change Research, United Kingdom) http://dx.doi.org/10.1016/j.scitotenv.2015.04.124 Published by Elsevier B.V. This is an open access article under the CC BY-NC-ND license (http://creativecommons.org/licenses/by-nc-nd/4.0/). eprints.soton.ac.uk
The DELTAS project will work toward a science-based GBM-customized integrative modeling framework which will be implement, in collaboration with regional experts, to assess delta vulnerability to current and future conditions and guide sustainable management and policy. At the heart of the GBM sustainability lies the question of how patterns of flooding and sediment aggradation offset delta sinking due to rising sea level and subsidence. This is a first order question to sustainability of the landscape, regardless of land use and management decisions. For the GBM delta specifically, the immense population and associated pressures on natural resources brings to the forefront the question of how environmental changes are affecting the socio-ecosystem services in coastal Bangladesh. The integrated assessment of these circumstances will aim to reveal whether there are management alternatives that will more effectively sustain ecosystem services, and populations and their livelihoods in coastal Bangladesh. Source: delta.umn.edu
Floods: Holding back the tide
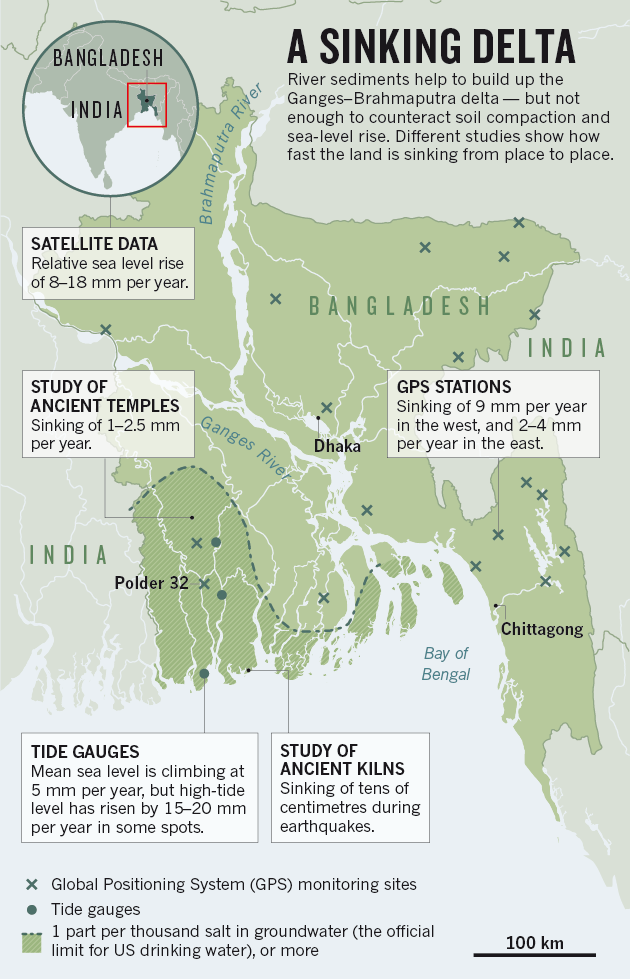
With the Ganges–Brahmaputra delta sinking, the race is on to protect millions of people from future flooding.Sources: Satellite: Ref. 1; Temples: M. H. Sarker; GPS: M. Steckler; Tide: Ref. 2; Kilns: Ref. 3; Salt: Bangladesh Climate Change Strategy and Action Plan 2009; Schiermeier, Q. (2014). Holding back the tide. Nature, 508(164166), 5. nature.com
In the wake of Cyclone Aila in 2009, swollen seas washed over the delta of the Ganges and Brahmaputra rivers. The storm surge breached the embankments surrounding a small island that was home to 10,000 families, turning the land into a muddy hell. The deluge of salty water washed out fields, homes, roads and markets just as people had begun to recover from the damage caused 18 months before by Cyclone Sidr. Many migrated to nearby cities. And thousands more took shelter on what remained of the embankments, where lack of sanitation and privacy would soon spur disease and crime.
When Steven Goodbred, an Earth and environmental researcher at Vanderbilt University in Nashville, Tennessee, came across this site during a field trip in 2011, he and his students were shocked to find the land still badly flooded and thousands of families living in tents and ramshackle huts. The broken embankments had been poorly repaired and the homesteads that they were supposed to protect remained uninhabitable. “It looked as desolate as the Moon — mud everywhere,” says Goodbred. “I'd never seen anything like it.” He made it his mission to determine how the embankments around the island, called Polder 32 after the Dutch word for land protected by dikes, had been eroded and undermined enough for a relatively small storm to wreak such havoc.
<...> That only adds to bigger problems in the Ganges–Brahmaputra delta, which is sinking so rapidly that the local, relative sea level may be rising by up to 2 centimetres each year. And Bangladesh's population of more than 150 million people is projected to grow by a further 50 million by 2050, putting more people in harm's way.
<...>
For subsidence rates in Bangladesh, he says, “depending on how and where you measure, you might get 15 different values”.
Things are dramatically different between the west and east sides of the delta, for example. Over the past several centuries, geological forces and erosion have shifted the lower stretch of the Ganges steadily to the east, leaving the western parts of the delta especially starved of sediment. That makes the southwest particularly vulnerable to both seawater flooding and intrusion of salt into groundwater, which can make the water unfit to drink.
<..>
Syvitski's work with satellite data1 suggests that the delta is sinking below sea level by between 8 and 18 millimetres per year. But those numbers need to be checked against ground-based measurements — which are now on the way. Michael Steckler, a geologist at Columbia University's Lamont–Doherty Earth Observatory in Palisades, New York, has been installing a network of Global Positioning System (GPS) receivers to monitor subsidence since 2003. He currently maintains around 20 sites, including one established on Polder 32 last year. So far, the results suggest subsidence rates of some 9 millimetres per year in the southwest, and just 2–4 in the southeast. But the sites are still few and far between, and there are not many in the most vulnerable locations.
<...> Tide-gauge records from three locations in the southwest suggest a mean rate of relative sea-level rise of about 5 millimetres per year over the past 30 years, but some local spots have experienced an average annual high-water-level increase of 15–20 millimetres.Source: Schiermeier, Q. (2014). Holding back the tide. Nature, 508(164166), 5. nature.com
‘Sunderbans sea level rising at an ‘alarming’ rate’
31 March, 2015. The sea level in the Sundarbans is rising at an “alarming” level, endangering the habitation, said a World Bank report.
The report stated that the sea level could witness an estimated 3 to 8 mm rise per year and mainly attributed it to land subsidence caused by various natural and anthropogenic processes, NDTV reports on its online site.
The report, titled “Building Resilience for Sustainable Development of the Sunderbans - Strategy Report” said, “Parts of the coast in the south were rising because of uplift which illustrates that impacts were not homogeneous and differ according to varying geological processes.” Source: en.prothom-alo.com
Malaysia
Vertical land motion trend colour map derived from GPS data over Peninsular Malaysia and, Sabah and Sarawak. Units are in mm/yr. 1999-2011
Source: Jebur, M. N., Pradhan, B., & Tehrany, M. S. (2014). Detection of vertical slope movement in highly vegetated tropical area of Gunung pass landslide, Malaysia, using L-band InSAR technique. Geosciences Journal, 18(1), 61-68. researchgate.net
Indonesia
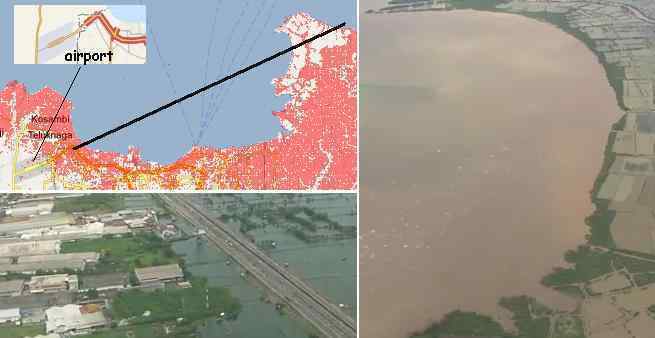
.How accurate a guide are the current elevation maps provided by Google and GPS? If they reflect land that lies on solid rock, on a plate that will remain level and not tilt, accurate enough. But as we have explained, Java and Sumatra are land that is rubble, scrapped up as the plate tongue has been pushed down in the past. It is an illusion of solid land when rubble can jumble and toss. The placement of Jakarta in the past involved some logic, as tests were made to determine if the rock beneath could sustain buildings. But sinking is occurring there, not admitted in the press. At some point the airport will become unusable. In addition to the issue of solid rock vs jumble, there is the issue of the accordion folding of the plate tongue. Some parts will rise, others sink, and this will not be an even process nor even predictable. Thus Google will not be a certain guide to what lands will sink or stay above the waves.
ZetaTalk Chat Q&A for January 22, 2011
Yellow, red area sinking. Yellow areas 4-2 cm/year sinking
Chaussard, E., Amelung, F., Abidin, H., & Hong, S. H. (2013). Sinking cities in Indonesia: ALOS PALSAR detects rapid subsidence due to groundwater and gas extraction. Remote Sensing of Environment, 128, 150 161. estellechaussard.com
[1] 8 June, 2016. Hundreds of Houses in Probolinggo Awash Flood Rob. Source: news.merahputih.com
[2] 9 December, 2012. Anticipate Flood Rob. Source: jumbojade17.blogspot.ru
[3] 31 May, 2013. Rob seawater flooding in the port of Semarang. Source: twitter.com
[4] 7 June, 2016. Tidal flood in the Port of Muara Baru Source: foto.okezone.com
[5] 8 September, 2015. Flood Rob Still a Major Problems in Semarang Source: 100rcsemarang.org
[6] 20 June, 2016. semarang.bisnis.com
Land subsidence magnitudes as derived by GPS surveys from 1998 to 2014 (Wibowo, 2014).
Abidin, H. Z., Andreas, H., Gumilar, I., & Wibowo, I. R. R. (2015). On correlation between urban development, land subsidence and flooding phenomena in Jakarta. Proceedings of IAHS, 370, 15-20. CC Attribution 3.0 License
Impacts of land subsidence on flooding phenomena.
Abidin, H. Z., Andreas, H., Gumilar, I., & Wibowo, I. R. R. (2015). On correlation between urban development, land subsidence and flooding phenomena in Jakarta. Proceedings of IAHS, 370, 15-20. CC Attribution 3.0 License
Source: slideshare.net
Source: slideshare.net
Source: slideshare.net
-
Comment by Stanislav on October 22, 2016 at 6:36pm
-
Philippines
This handout photo taken on August 8, 2012 and released by the Department of National Defense (DND) shows an aerial shot of floodings around Malabon town, suburban Manila. More than a million people in and around the Philippine capital battled deadly floods August 8, as more monsoon rain fell, with neck-deep waters trapping both slum dwellers and the wealthy on rooftops. AFP PHOTO/DND. Source: newsinfo.inquirer.netResults of DInSAR and InSAR time series analysis by using ENVISAT/ASAR, ALOS/PALSAR and TerraSAR-X data.
Deguchi, T. (2014, October). Deformation monitoring in the metro Manila using ALOS/PALSAR. In SPIE Remote Sensing (pp. 924315-924315). International Society for Optics and Photonics. a-a-r-s.org
Profile of surface displacement in line of sight
Source: Deguchi, T. (2014, October). Deformation monitoring in the metro Manila using ALOS/PALSAR. In SPIE Remote Sensing (pp. 924315-924315). International Society for Optics and Photonics. a-a-r-s.org
Taiwan
Land subsidence occurs in municipalities and counties throughout Taiwan, including Taipei and Yilan in the north, and Changhua, Yunlin, Chiayi, and Pingdong in Central and Southern Taiwan as shown on Map. Maximal subsidence ranges from 1.2 m to 3.2 m, affecting an area of 2000 km2. The most severely affected areas are located in Yunlin County. Their effects include dike failures, seawater encroachment in coastal aquifers, coastal inundation, and salinity intrusion.
Distribution of land subsidence in Taiwan from 1972 to 2012 (adapted from the Water Resources Agency, Ministry of Economic Affairs, Taiwan).
Source: Hsu, W. C., Chang, H. C., Chang, K. T., Lin, E. K., Liu, J. K., & Liou, Y. A. (2015). Observing Land Subsidence and Revealing the Factors That Influence It Using a Multi-Sensor Approach in Yunlin County, Taiwan. Remote Sensing, 7(6), 8202-8223. This is an open access article distributed under the Creative Commons Attribution License (CC BY 4.0).
Cumulative land subsidence obtained by leveling data in Yunlin County from 1992 to 2013. The figure shows various time spans of cumulative land subsidence from (a–g): (a) 1992–1999; (b) 1992–2003; (c) 1992–2005; (d) 1992–2007; (e) 1992–2009; (f) 1992–2011; (g) 1992–2013.
Source: Hsu, W. C., Chang, H. C., Chang, K. T., Lin, E. K., Liu, J. K., & Liou, Y. A. (2015). Observing Land Subsidence and Revealing the Factors That Influence It Using a Multi-Sensor Approach in Yunlin County, Taiwan. Remote Sensing, 7(6), 8202-8223. This is an open access article distributed under the Creative Commons Attribution License (CC BY 4.0).
(a) SAR mean LOS velocity map from 2007 to 2010; (b) raster map interpolated from (a)
Source: Hsu, W. C., Chang, H. C., Chang, K. T., Lin, E. K., Liu, J. K., & Liou, Y. A. (2015). Observing Land Subsidence and Revealing the Factors That Influence It Using a Multi-Sensor Approach in Yunlin County, Taiwan. Remote Sensing, 7(6), 8202-8223. This is an open access article distributed under the Creative Commons Attribution License (CC BY 4.0).
Taiwan Continuous GPS Data Analysis and a Study on Earthquake Precursor Detection (PI: Yu, Shui-Beih) Source: earth.sinica.edu.tw
Cumulative subsidence derive from leveling over 1992–2013.
Source: Hung, W. C., Wang, C., Hwang, C., Chen, Y. A., Chiu, H. C., & Lin, S. H. (2015). Multiple sensors applied to monitorland subsidence in Central Taiwan.Proceedings of the International Association of Hydrological Sciences, 372, 385-391. CC Attribution 3.0 License.
(a) Distributions of continuous GPS stations in CRAF (b) Vertical displacement rate from GPS over April 2010–April 2011
Source: Hung, W. C., Wang, C., Hwang, C., Chen, Y. A., Chiu, H. C., & Lin, S. H. (2015). Multiple sensors applied to monitorland subsidence in Central Taiwan.Proceedings of the International Association of Hydrological Sciences, 372, 385-391. CC Attribution 3.0 License.
Vertical displacement rate from TCPINSAR over 2007–2011.
Source: Hung, W. C., Wang, C., Hwang, C., Chen, Y. A., Chiu, H. C., & Lin, S. H. (2015). Multiple sensors applied to monitorland subsidence in Central Taiwan.Proceedings of the International Association of Hydrological Sciences, 372, 385-391. CC Attribution 3.0 License.
Vietnam
Maximum rate of hydraulic head decline (i.e., drawdown) among aquifers, interpolated from monitoring well data. Well locations are labeled alphabetically. (B). Compaction-based subsidence rates, interpolated from calculations at well locations. Subsidence is a function of both head decline and clay thickness. Dashed lines are interpreted outside of area of data coverage. (C). InSAR-based line of sight rates of land subsidence. Data © JAXA, METI 2011. All rates in panels A–C are annual averages over the period 2006–10.
Source: Erban, L. E., Gorelick, S. M., & Zebker, H. A. (2014). Groundwater extraction, land subsidence, and sea-level rise in the Mekong Delta, Vietnam. Environmental Research Letters, 9(8), 084010.
Content from this work may be used under the terms of the Creative Commons Attribution 3.0 licence. Any further distribution of this work must maintain attribution to the author(s) and the title of the work, journal citation and DOI.
Hanoi, Vietnam
Source: en.wikipedia.org
(A) Averaged 2007 – 2009 LOS velocity map of nearly full Hanoi area, overlaying the topographic map of Hanoi.
(B) LOS deforming map of urban districts near the Red River and West Lake (Tay Ho).
(C) Land subsidence map of western Tu Liem and Eastern Hoai Duc, PS X and Y are two reference points to measure temporal evolution in Section 3.
(D) Land subsidence map of Ha Dong and southern Thanh Xuan.
(E) Land subsidence map of Hoang Mai.
(F) Land subsidence map of Luong Son.
(G) Ground deformation map of My Duc.
This study has presented the short-term ground deformation of nearly-full area of Hanoi, mapped by an ALOS PALSAR stack between 2007 and 2009. By using advanced InSAR time series technique, various subsidence areas were located and discussed, especially new subsidence region that has never been studied before in Luong Son and My Duc districts. For those deforming area in the center of the city, the results show great agreements with previous studies, confirming the subsidence rate of surrounding urban area including Hoang Mai, Ha Dong and Tu Liem is at high level (over 40 mm/year). Temporal evolution analysis was also performed to confirm the consistent of the results.
Le, S. T., & Chang, C. P. (2015, October). Surface deformation assessments in Hanoi, Vietnam using ALOS PALSAR interferometry. In Proceedings of the 36th Asian Conference on Remote Sensing (ACRS 2015), Manila, Philippines (pp. 19-23).
North Vietnam
(A) Map of South East Asia fault zone; (B) Tectonic structures and fault zones in northern Vietnam (modified after Zuchiewicz et al., 2013). Song stands for river, FZ: fault zone.
The coverage and the average displacement velocities of the RRFZ from the boundary between Vietnam and China (Lao Cai) to the area nearby Ha Noi (Phu Tho), overlaying northern Vietnam topography map. Dark brown lines represent Red and Chay river fault.
(A)
(B)
(C)
(A) Averaged surface deformation map of RRFZ in Lao Cai area. The dark lines present faults system. LOS velocity ranged from -60 to 60 mm per year. (B) Averaged surface deformation map of RRFZ near Yen Bai city. (C) Averaged surface deformation map of RRFZ near Viet Tri city
Nguyen, Xuan Thi; Chang, Chung-Pai (2015) MAPPING SURFACE DEFORMATION IN RED RIVER FAULT ZONE USING SPACEBORNE SAR INTERFEROMETRY In Proceedings of the 36th Asian Conference on Remote Sensing (ACRS 2015), Manila, Philippines
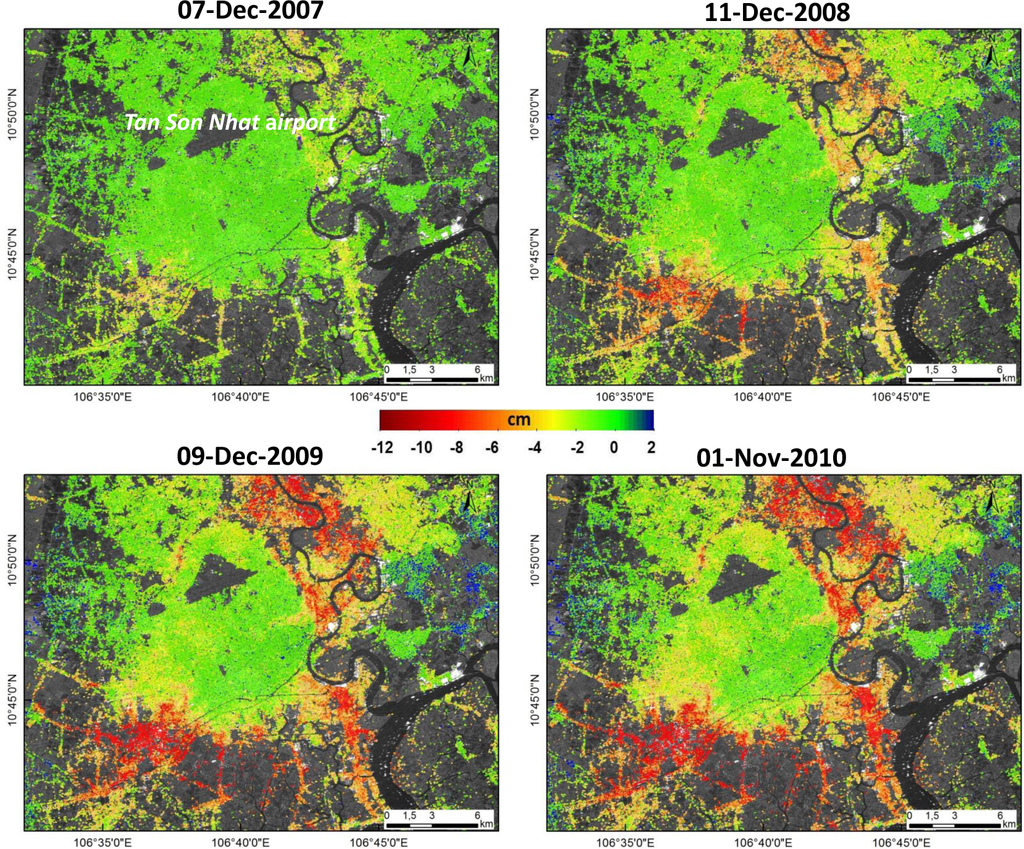
The vertical displacement history from 2006 to 2010. Positive velocities (blue colors) represent uplift; negative velocities (red colors) represent subsidence. The background is the average backscatter ALOS PALSAR data.
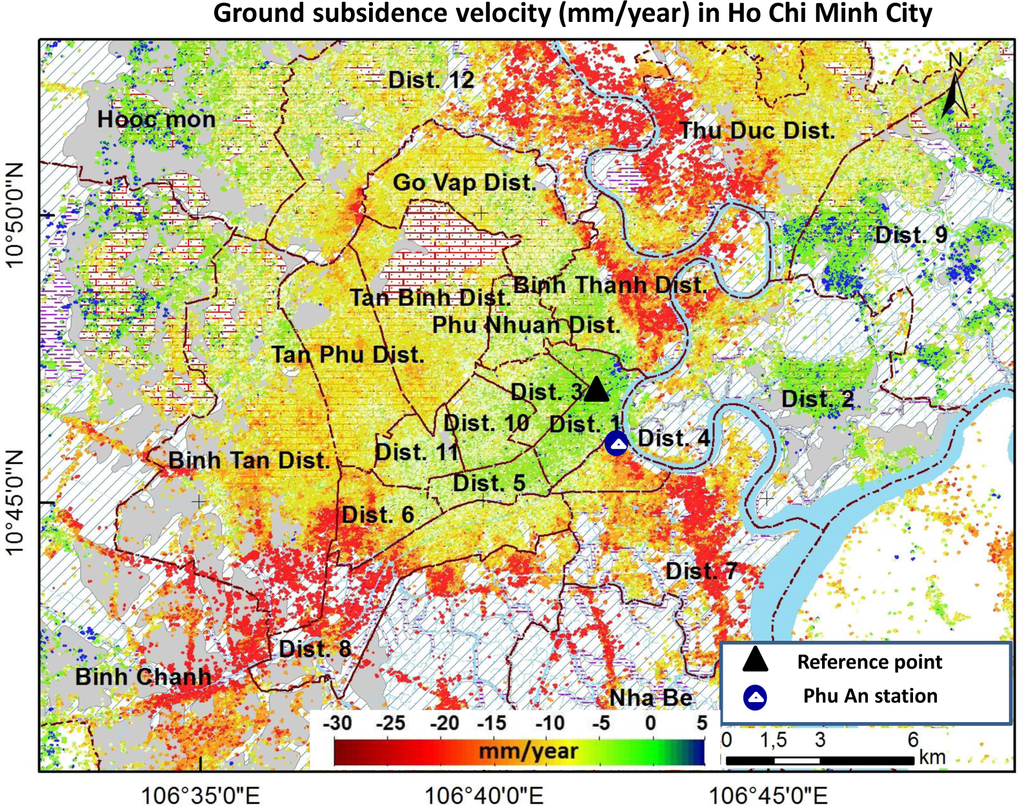
The average velocity trend from 2006 to 2010. Positive velocities (blue colors) represent movement uplift; negative velocities (red colors) represent movement subsidence.
Minh, D. H. T., Van Trung, L., & Toan, T. L. (2015). Mapping ground subsidence phenomena in Ho Chi Minh City through the radar interferometry technique using ALOS PALSAR data. Remote Sensing, 7(7), 8543-8562. Source: mdpi.com
This article is an open access article distributed under the terms and conditions of the Creative Commons Attribution license (http://creativecommons.org/licenses/by/4.0/).
Averaged vertical subsidence velocity in urban region of Hanoi issued from InSAR processing for the period February 2007–February 2011
Dang, V. K., Doubre, C., Weber, C., Gourmelen, N., & Masson, F. (2014). Recent land subsidence caused by the rapid urban development in the Hanoi region (Vietnam) using ALOS InSAR data. Nat. Hazards Earth Syst. Sci, 14, 657-674. CC Attribution 3.0 License. nat-hazards-earth-syst-sci.net
Each year, Ca Mau sinks by 1.71 cm
Dr. Do Van Linh, Deputy Head of the Southern Region Geological Mapping Federation, said the deepest subsidence in Ca Mau was measured 1.71 cm a year, while the average subsidence due to groundwater exploitation was about 0.35 cm a year.
There are three reasons for this situation: subsidence due to young sediment and water exploitation, and by tectonic movements. This trend will continue in the coming years.
If the exploited water volume is divided for the total area of Ca Mau province (approximately 4,350 km2), the speed of subsidence is 1.9 to 2.8 cm a year. If the area of Ca Mau province is 5,300 km2 instead of 4,350 km2, the subsidence rate is 1.56 to 2.30 cm a year. Source: talkvietnam.com
Flooded Saigon - what are the causes?
26 September, 2016. <...> Many sunken areas have subsided as the silt foundation was suppressed by millions of tons of reinforced concrete, brick, mortar, and stone. In Thao Dien, District 2, in the 10 years from 1997 to 2007, subsidence was recorded of about 5cm - 7cm per year in some locations. Since then, flooding caused by high tides has occurred in the city’s low-lying areas. Source: english.vietnamnet.vn
Thailand
Study area
"The application of the technique on 10 Radarsat-1 satellite images covering the eastern coast of the inner Gulf of Thailand reveal fast subsidence in many areas, particularly at Golf course, Mueang Chon buri, Laem Chabang deep-sea port and Cape Sa-Mae-Saan."
Aobpaet A; Trisirisatayawong I; Hooper A (2011) Coastal zone deformation over eastern inner Gulf of Thailand using multi-temporal InSAR method, 32nd Asian Conference on Remote Sensing 2011, ACRS 2011, 1, pp.120-125. a-a-r-s.org
Bangkok
Source: bangkokpost.com
Australia
The Perth metropolitan region is subsiding, research suggests
Source: travelieu.com
21 October, 2015. Curtin University research indicates that large parts of the Perth Basin are subsiding due to groundwater extraction, which could make parts of Perth more vulnerable to the effects of rising sea levels.
Professor Will Featherstone and Dr Mick Filmer, from Curtin’s Institute for Geoscience Research (TIGeR) and the WA School of Mines Department of Spatial Sciences, completed the research as part of Australian Research Council grants issued to study subsidence in the Perth Basin, its effect on heights and how it impacts sea level change recorded by tide gauges. news.curtin.edu.au
Scientist warns Perth basin is subsiding
17 October, 2007. One of Australia's leading scientists says the subsidence of the Perth basin could have long term consequences for building and the supply of services to the city. Source: abc.net
-
Comment by SongStar101 on October 20, 2016 at 10:33pm
-
Massive and Mysterious Ice Fall in Tibet (Largest/Fastest Glacier movement ever recorded)
http://earthobservatory.nasa.gov/IOTD/view.php?id=88677&src=twi...
On July 17, 2016, a huge stream of ice and rock tumbled down a narrow valley in the Aru Range of Tibet. When the ice stopped moving, it had spread a pile of debris that was up to 30 meters (98 feet) thick across 10 square kilometers (4 square miles). Nine people, 350 sheep, and 110 yaks in the remote village of Dungru were killed during the avalanche.
The massive debris field makes this one of the largest ice avalanches ever recorded. The only event of a comparable size was a 2002 avalanche from Kolka Glacier in in the Caucasus , explained Andreas Kääb, a glaciologist at the University of Oslo.
A multispectral imager on the European Space Agency’s Sentinel-2 satellite captured an image of the debris field on July 21, 2016. The Operational Land Imager, a similar instrument on Landsat 8, acquired an image on June 24, 2016, that shows the same area before the avalanche.
The cause of the avalanche is unclear. “This is new territory scientifically,” said Kääb. “It is unknown why an entire glacier tongue would shear off like this. We would not have thought this was even possible before Kolka happened.”
Kääb’s preliminary analysis of satellite imagery indicates that the glacier showed signs of change weeks before the avalanche happened. Normally, such signs would be clues the glacier might be in the process of surging, but surging glaciers typically flow at a fairly slow rate rather than collapsing violently in an avalanche.
After inspecting the satellite imagery, University of Arizona glaciologist Jeffrey Kargel agreed that a surging glacier could not be the cause. “The form is completely wrong,” he said. “It must be a high-energy mass flow. Maybe liquid water lubrication at the base played some role,” he said.
Tian Lide, a glaciologist at the Chinese Academy of Sciences, described the avalanche as “baffling” because the area where the ice collapse began is rather flat. “My team failed to reach the upper part of the glacier for safety reasons,” he said in an email, “but we will go the upper part [later] to see if we can find some more hints about what caused the glacier disaster.”
-
Comment by SongStar101 on October 20, 2016 at 8:47pm
-
Hundreds of deep-sea vents found spewing methane off US coast
https://www.newscientist.com/article/2109698-hundreds-of-deep-sea-v...
Methane is gushing forth from hundreds of newly-discovered deep-sea vents all along the US’s western seaboard.
“It appears that the entire coast off Washington, Oregon and California is a giant methane seep,” says Robert Ballard, founder and director of the Ocean Exploration Trust in Connecticut.
In all, 500 new seeps were discovered by submersibles operated from the trust’s ship, Nautilus (see video below). The discovery will be presented this week in New York at the National Ocean Exploration Forum.
However, there’s still work to be done to pin down the exact composition of the bubbles coming from the seeps. “Members of our group are analysing the samples taken in June for a wide range of gases,” says Robert Embley, chief scientist on the Nautilus.
Embley says that previous samples from similar sites were mostly methane, but methane hydrate – made from water and methane – can form too.
Methane has the potential to accelerate global warming because it traps heat 40 times as effectively as carbon dioxide. Knowing how much is gushing out of the seeps and what amount makes it into the atmosphere should enable estimates of their impact on global warming in the future.
“The first step to finding out is getting a baseline of what’s coming out of the seafloor at present,” says Embley.
The team thinks it is likely that they will find yet more seeps on the seafloor off the eastern US. “We hope there will be opportunities for more mapping in the next couple of field seasons to get a more complete baseline of sites,” says Embley.
-
Comment by Kojima on September 29, 2016 at 2:20pm
-
* Monitoring of Ground Motion in REV
http://rev.seis.sc.edu/index.html
http://rev.seis.sc.edu/stations.html
[African Roll and Mediterranean Drop]
GE.EIL: GEOFON Station Eilat, Israel; 29.67 N, 34.95 E
[2016/09/26 - 09/28]
See also a comment by me on June 23 - Station GE.EIL; REV chart [2016/06/01 -06/22]
-
Comment by Kojima on September 29, 2016 at 9:24am
-
* Monitoring of Ground Motion in REV
http://rev.seis.sc.edu/index.html
http://rev.seis.sc.edu/stations.html
[South American Roll]
IU.OTAV; Otavalo, Ecuador; 0.24 N, 78.45 W
[2016/09/15 -09/28]
-
Comment by Kojima on September 29, 2016 at 8:28am
-
* Monitoring of Ground Motion in REV
http://rev.seis.sc.edu/index.html
http://rev.seis.sc.edu/stations.html
[Tipping Indo-Australia Plate]
II.NIL; Nilore, Pakistan; 33.65 N, 73.27 E
[2016/09/06 - 09/28]
SEARCH PS Ning or Zetatalk
This free script provided by
JavaScript Kit
Donate
© 2025 Created by 0nin2migqvl32.
Powered by
![]()









You need to be a member of Earth Changes and the Pole Shift to add comments!
Join Earth Changes and the Pole Shift