Earth polarity increasing
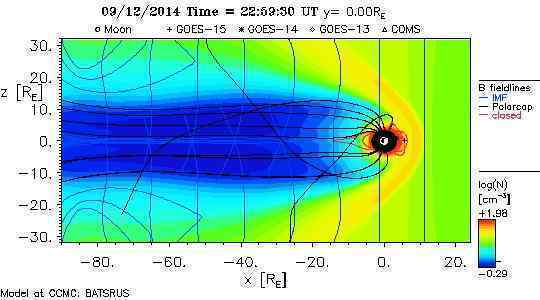
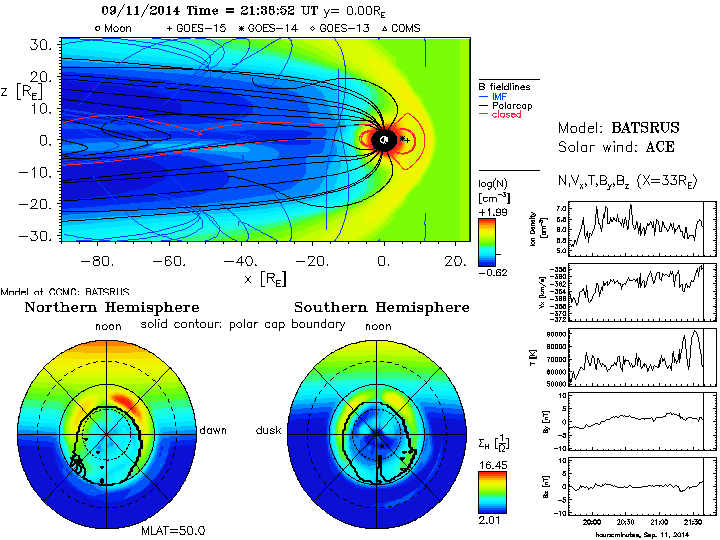
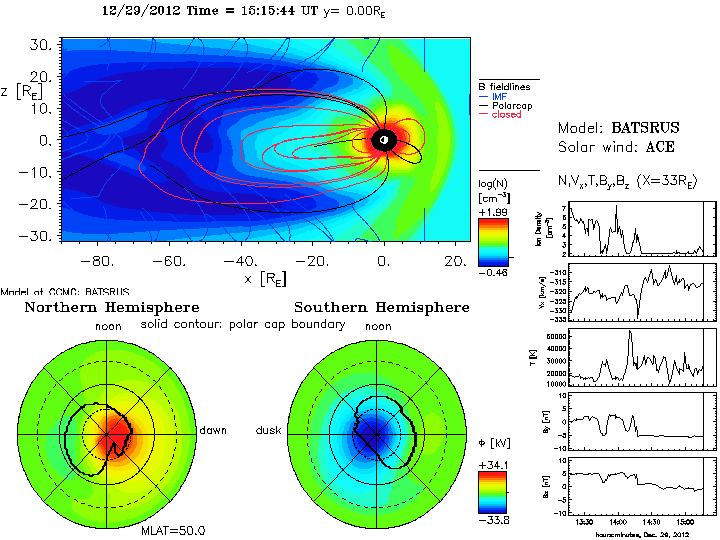
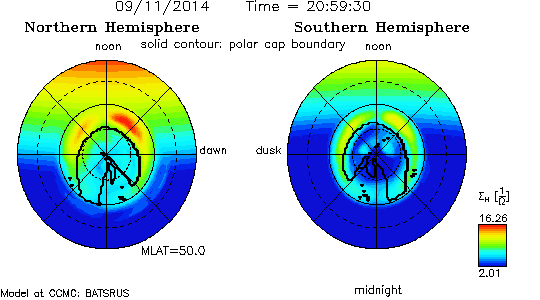
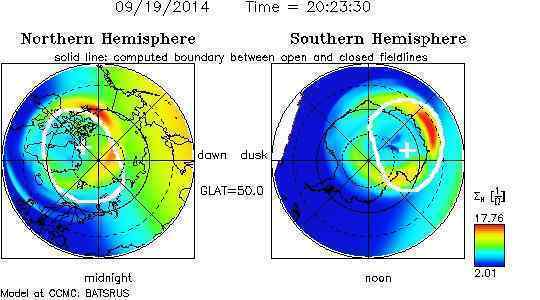
It appears Earth's magnetosphere has entered new territory with respect to the magnetic onslaught from Planet X. In addition to an unprecedented magnetospheric compression that prevailed for several days between September 12 and 18, Earth's ionosphere also suddenly began exhibiting signs of disproportionate electrostatic potential on September 11. In the past, even during severe compressions, ionospheric potential was mostly uniform beyond the polar regions. Since September 11 at approximately 21:00 UTC, ionospheric potential is increasingly at the lowest level on the side of Earth facing away from the Sun. Can the Zetas please explain why this is now occurring?
http://ccmc.gsfc.nasa.gov/cgi-bin/SWMF_RealTime_browse.cgi
http://ccmc.gsfc.nasa.gov/models/modelinfo.php?model=Weimer
http://ccmc.gsfc.nasa.gov/cgi-bin/display/RT_t.cgi?page=potential
http://iswa.ccmc.gsfc.nasa.gov:8080/IswaSystemWebApp/
http://en.wikipedia.org/wiki/Ionosphere
[and from another] http://en.wikipedia.org/wiki/Atmospheric_electricity Earth is surrounded by a magnetosphere. The magnetosphere is the location where the outward magnetic pressure of the Earth's magnetic field is counterbalanced by the solar wind, a plasma. Most of the solar particles are deflected to either side of the magnetopause. The ionosphere is the inner edge of the magnetosphere and is the part of the atmosphere that is ionized by solar radiation. [and from another] http://www.briangwilliams.us/meteorology/the-atmospheric-capacitor.... The earth is a fairly good conductor of electricity. So is the upper part of the atmosphere known as the ionosphere. The air between these two conducting regions, in the troposphere (where most weather occurs) and in the stratosphere, is a poor conductor of electric current. The troposphere and stratosphere of the earth compose a good electrical insulator, but it is not perfect. Vertical air currents, and regions of high moisture content, produce channels of higher conductivity than that of the surrounding air. Cumulonimbus clouds, which sometimes reach to the top of the troposphere, present paths of better ground-to-ionosphere conductivity than stable, dry air.
The common man can sense that the Earth is being bombarded by magnetons from the N Pole of Planet X. This is being documented by the increase in blackouts, static on radio and TV, planes disappearing from radar, planes crashing from electrical problem, and satellite failures for GPS and GLONAS. Earth scientists note this by capturing the electrical potential, (ie the difference between the positive charge of the Ionosphere and the negative charge of Earth) and measuring the strength and components of the Solar Wind.
When magnetosphere charts show the magnetosphere “compressing” it means that the Earth’s magnetosphere cannot compete and is being corrupted by either a larger magnetosphere (ie Nibiru, aka Planet X) or an intense blast from the Sun. For the past decade, the deforming magnetosphere of Earth cannot be explained by the Solar Wind, though the lingering cover-up over the presence of Nibiru in the inner solar system has NASA trying to relate magnetosphere problems with solar activity. NASA freely lies, and has been doing so for over a decade, blaming these problems on non-existent or slight solar activity. That these magnetic blasts are coming from Planet X can hardly be denied.
The protection that the magnetosphere affords to Earth is described by Earth scientists as a deflecting of the Solar Wind at what is assumed to be the outer edge of the Earth’s magnetosphere, at the point where the Ionosphere resides. When the magnetosphere becomes compressed, the bombardment by the Sun is assumed to drive the electrostatic charge in the atmospheric layers closer to the Earth, thus increasing lightning discharge and potentially interfering with mankind’s electrical systems. This has been happening lately, an increase in lightning and blackouts, and will increase without abatement in the future.
Magnetic and electric particles are known to be attracted to each other, and flow together. The Earth is assumed to have a negative charge, as lightning discharges to its surface. The poles likewise are assumed to have a positive charge at the N Pole, which is the outbound flow of magnetons, and negative at the S Pole, the intake. Prior to September, 2014 the familiar equilibrium where the assumed edge of the Earth’s magnetosphere, ie the Ionosphere, would bear the brunt of electrical incitement, ie a positive charge from the bombardment of solar rays, existed.
Now under the intense assault from the magnetosphere of Planet X, the point where a positive charge is kept at a distance has diminished. It is closer to Earth. This is noted as both an increased negative charge for much of the Earth, and a higher voltage in the Ionosphere. That the negative charge is on the side opposite the Sun and Planet X is noteworthy, as it is due of course to the blast of magnetons and accompanying electrons from the N Pole of Planet X, though NASA might continue to try to blame the Sun. We have long warned that blackouts would increase, satellites would increasingly fail, and air travel become increasingly risky. That time has arrived.
Source:ZetaTalk Chat Q&A for September 27, 2014
Comment
-
Comment by M. Difato on March 21, 2019 at 9:24am
-
BATSRUS Y-Cut magnetic field lines magnetosphere cygnet continues showing strong polarity increases
March 16-21, 2019 with the typical missing frames/time.
March 20th had 2 polarity increases within an hour. At the start of the second increase the Y-Cut and other
magnetosphere cygnets had missing frames/time for well over 3 hours (*) .
-
Comment by M. Difato on March 15, 2019 at 7:19pm
-
Here is a look at the BATSRUS Y-Cut magnetic field lines, magnetosphere cygnet during strong Polarity Increases these past few days. All have the normal missing frames/time on avg.15-20 minutes before these events.
Source (Images): https://ccmc.gsfc.nasa.gov/iswa/
-
Comment by M. Difato on February 18, 2019 at 12:55am
-
BATSRUS Y-Cut and IEP w/Polar Cap showing a polarity increase before going offline or missing images/time for over 9 Hrs.. It's unusual to for the Y-Cut to show an image of a polarity increase before missing frames as seen February 16, 2019 @ 23:59 UTC..
other missing frame/time events from today,also showing this polarity increase (in the right side first return frame).
Discover (left ) and Ace (right) readings taken offline during this event.
Clearly it's not the Sun.
Sources :
-
Comment by M. Difato on October 9, 2018 at 7:07pm
-
A strong increased negative charge for much of the Earth as seen on the BATSRUS cygnets October 8,2018
SMWF2011+RCM Ionospheric Electric Potential w/Polar Cap
10/8/2018 T16:05 - T17:55 UTC
*Offline/missing time from T16:13 - 16:37 and T17:35 - 17:53.
(Inverted for a different perspective)
Batsrus Y-Cut for the same time period (between missing frames)
BATSRUS -Magnetopause Position , for the same time period (between missing frames)
-
Comment by M. Difato on September 12, 2017 at 3:49pm
-
Photos: Nearly 40,000 Lightning Strikes Flashed Across Southern California In Series Of Storms
http://laist.com/2017/09/11/40000_lightning_strike.php
A series of lightning storms swarmed Southern California on Sunday (SEPT 10), bringing nearly 40,000 lightning strikes to the region.
Kathy Hoxsie, a meteorologist at the National Weather Service, told LAist that a “cluster” of storms had developed over the National Weather Service's Los Angeles’ service regions, which include L.A., Ventura, Santa Barbara, and San Luis Obispo counties. She added that those 40,000 lightning strikes were tallied over a period from 7 a.m. Sunday to 7 a.m. Monday.
Hoxsie said that most of the lightning was contained to Ventura and Santa Barbara counties. “The thunderstorms started off more in the coastal areas. Many started off the Channel Islands, and throughout the day they just blossomed,” said Hoxsie.
NWS tweeted out some graphics showing how widespread the strikes were:
https://twitter.com/NWSLosAngeles/status/907267295952691202
Unsurprisingly, the lightning made a big showing on social media. From professional time-lapse photos to panoramic videos and hazy, spectral shots, the lightning showed up in different forms. Here are some of the ones we ran across:
https://www.instagram.com/p/BY6PZNzl6xf/
https://www.instagram.com/p/BY5_yMUh8vv/
~
Power surge: 800 lightning bolts strike San Francisco in 1 day (PHOTOS, VIDEOS)
https://www.rt.com/usa/403035-san-francisco-lightning-storm-videos/
https://twitter.com/NBCSGiants/status/907418175586701312
After a spell of intense heat in the Bay Area, a huge storm finally broke over San Francisco on
Monday (Sept 11), unleashing more than 800 lightning strikes in mere hours, according to the National Weather Service.
https://twitter.com/NWSBayArea/status/907394684158443521
(Videos)
https://twitter.com/Rustybret/status/907431578237779968
-
Comment by Nancy Lieder on September 28, 2014 at 12:04pm
- ‹ Previous
- 1
- 2
- Next ›
SEARCH PS Ning or Zetatalk
This free script provided by
JavaScript Kit
Donate
© 2025 Created by 0nin2migqvl32.
Powered by
![]()

You need to be a member of Earth Changes and the Pole Shift to add comments!
Join Earth Changes and the Pole Shift