Magnetosphere skew

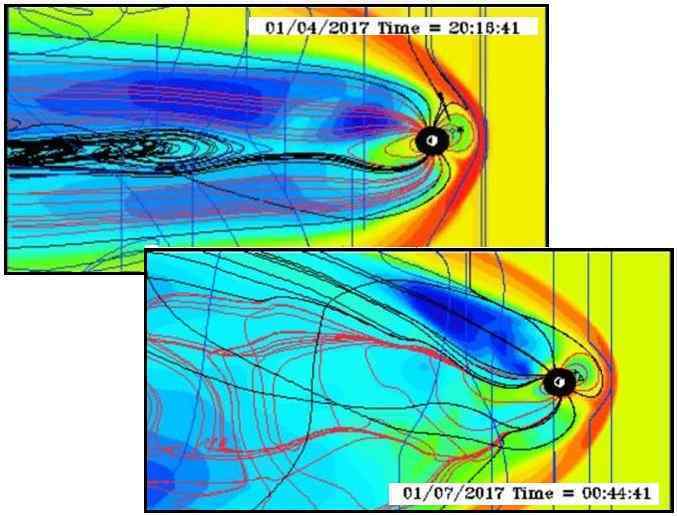
I have a question about a picture from NASA 's BATSRUS Magnetosphere simulator from 07 January 2017! Can ZETA give more explanation what we look at? From what pictures and videos I see in the last years from BATSRUS I did not remember to see the blue Field in that position. .It seems that is a strong flow that is coming from south of the elliptic some warping the earth magnetic field, earth axis is also is leaning, black flow Lines behind the earth are definitely tangled! Second question related: also the magnetic turbulence behind earth field it seems that are few per week is constant almost every 2 -3 days! This type of magnetic turbulence interference-assault, will be an linear increase for now-on or will be in stages?
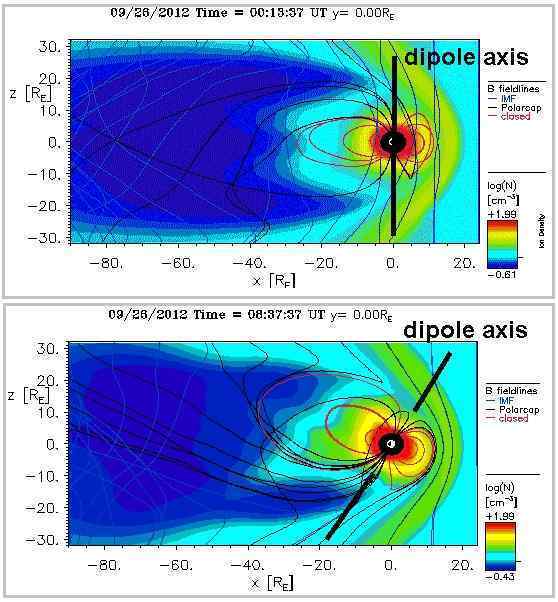
BATSRUS modeling shows the Earth’s magnetosphere from the side, with the bowshock absorbing the Sun’s blast on the right and the magnetosphere streaming out behind the Earth to the left. When Nibiru was approaching the Earth from the direction of the Sun, pointing its N Pole directly at the Earth, the Earth either tried to remain aligned with the Sun, or tilt its N Pole away, or tilt into opposition as it did in September of 2012. Opposition was modeled on BATSRUS with the dipole showing the N Pole of Earth tilting toward the Sun at that time.
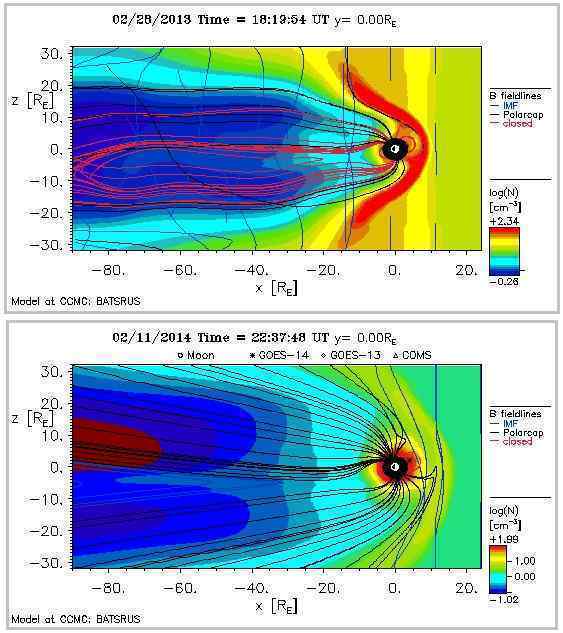
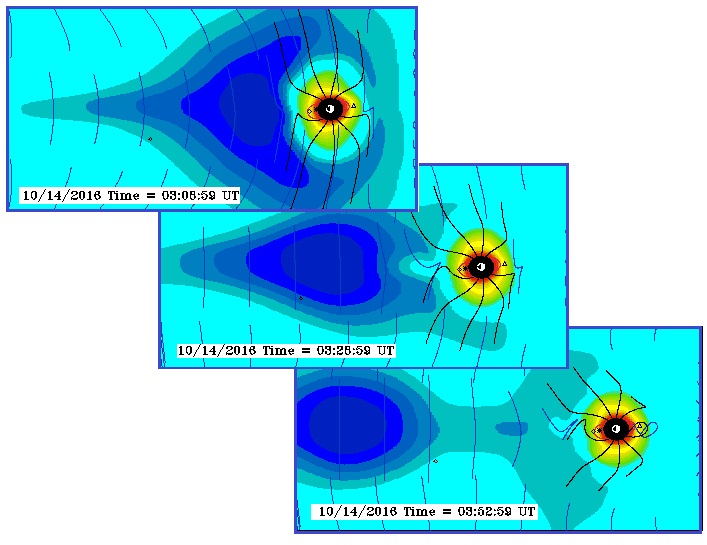
As Nibiru moved to the right of the Earth, the extreme blast from the N Pole of Nibiru seemed to come from the side, as it did in February, 2014. Here the dipole showed the N Pole of Earth tilted somewhat away from the Sun and Nibiru also, which is also due to the tilt of the Earth during Winter in the Northern Hemisphere. For a period of time in October, 2016 it was noted that the Earth’s magnetosphere seemed to be hugging close to the Earth, a defensive maneuver.
And now in January, 2017 yet another bizarre phenomena has been noted showing the dipole lean of the N Pole of Earth such that it is tilting its N Pole away from the Sun and the approaching Nibiru. Though it is Winter, and the dipole lean should reflect this in a slight lean, the magnetic poles are still trying to be aligned with the Sun. This dipole lean is extreme, and the confused magnetic field behind the Earth indicates a lean away from the Sun, pushing the N Pole of Earth away in a posture that would be expected during the 3 Days of Darkness. This is temporary, notably recorded by BATSRUS at midnight in Geneva, when the Polar Push is occurring over the Pacific.
Comment
-
Comment by Howard on May 17, 2021 at 4:04pm
-
Comment by M. Difato on May 9, 2021 at 7:11am
-
Comment by M. Difato on May 9, 2021 at 5:41am
-
BATSRUS Y-Cut showing several events of a skewed magnetosphere of the Earth (just ahead of midnight in Geneva) the past few nights.
May 8, 2021 T22:57 - T00:13 May 9, 2021
May 8, 2021 T18:13 - T22:21 UTC
May 7, 2021 T23:01 - T23:48 UTC
T19:57 - T21:01 UTC
May 6, 2021 T20:57 - T22:13 UTC
ACE Magnetic Field readings May 6-9, 2021
SWPC direct link: https://www.swpc.noaa.gov/products/real-time-solar-wind
note: "SWPC maintains the ability to instantaneously switch the spacecraft that provides the RTSW data. During times of outages in DSCOVR data or problems with the data, this page may instead display the data from the NASA/ACE spacecraft."
s
-
Comment by M. Difato on February 26, 2021 at 12:36pm
-
SWMF 2011+RCM Magnetosphere / BATSRUS Y-cut showing a confused magnetic field behind the Earth.
T19:31 UTC February 25, 2021 thru T02:23 UTC February 26, 2021
ACE and DISCVR Magnetic Field readings
Nominal Wind speed/velocity and Kp index readings.
-
Comment by M. Difato on January 5, 2021 at 4:36am
-
T23:18 (Jan 3) - T02:25 (Jan 4) UTC
ACE Magnetic Field readings: 18:00 (Jan 3) - 03:00 (Jan 4) UTC
NOAA SWPC (nT) 2 hour readings 22:55 (Jan 3) - 01:38 (Jan 4) UTC
https://www.swpc.noaa.gov/products/real-time-solar-wind
T22:57 (Jan 2) - T02:45 (Jan 3) UTC
ACE Magnetic Field readings: 18:00 (Jan 2) - 03:00 (Jan 3) UTC
NOAA SWPC (nT) 1 hour readings, 23:20 (Jan 2) - 00:55 (Jan 3) UTC
https://www.swpc.noaa.gov/products/real-time-solar-wind
T22:41 (Jan 1) - T02:45 (Jan 2) UTC
ACE Magnetic Field readings: 18:00 (Jan 1) - 03:00 (Jan 2) UTC
-
Comment by M. Difato on January 2, 2021 at 12:58pm
-
Ongoing now for the past 2 weeks, the relentless magnetic blasts to the magnetosphere of the Earth around midnight in Geneva,
Dec 29, 2020 - Jan 1, 2021.
T22:01 (Dec 31) - T02:17 (Jan 1) UTC
Corresponding ACE Magnetic Field readings
T20:53 (Dec 30) - T01:53 (Dec 31) UTC
T22:09 (Dec 29) - T01:25 (Dec 30) UTC
3 Day Kp index
(derived by calculating a weighted average of K-indices from a network of geomagnetic observatories. Displayed on a bar graph with color-coded NOAA Geomagnetic storm scales)
3 Day Solar Wind Speed and Velocity readings
3 Day NOAA - SWPC
-
Comment by M. Difato on December 29, 2020 at 11:49am
-
Comment by M. Difato on December 29, 2020 at 9:23am
-
Comment by M. Difato on December 27, 2020 at 2:16am
-
Following the end of the Fall Trimester ~ December 17, 2020 the last several nights around midnight in Geneva, the magnetosphere cygnets are showing strong magnetic blasts from Planet X and subsequent skewed and mangled magnetosphere of the Earth.
BATSRUS Y-Cut and ACE Magnetic Field readings.
T22:21 (Dec 24) - T01:37 (Dec25) UTC
T23:17 (Dec 23) - T00:57 (Dec 24) UTC
T22::05 (Dec 22) - T00:29 (Dec 23) UTC
T01:05 (Dec 21) - T02:01 UTC
T23:21 (Dec 20) - T00:41 (Dec 21) UTC
T23:51 (Dec 19) - T01:05 (Dec 20) UTC
T23:37 (Dec 18) - T01:25 (Dec 19) UTC
-
Comment by M. Difato on December 13, 2020 at 7:01pm
- ‹ Previous
- 1
- 2
- 3
- 4
- Next ›
SEARCH PS Ning or Zetatalk
This free script provided by
JavaScript Kit
Donate
© 2025 Created by 0nin2migqvl32.
Powered by
![]()


You need to be a member of Earth Changes and the Pole Shift to add comments!
Join Earth Changes and the Pole Shift