Weather:

Weather Wobble

Jet Stream tornados

Siberian Freeze Weather Wobble

Wild weather , [2]

Wobble Clouds

Hurricane development

Violent Push

Weather & ocean currents

Europe Weather

Tides and Whirlpools:

Storm Clash whirlpools

Lurch of earth

Tides , [2]

Whirlpools

Wobble Sloshing


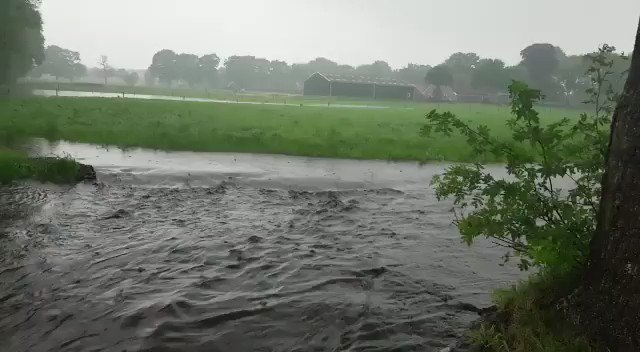
"We warned at the start of ZetaTalk, in 1995, that unpredictable weather extremes, switching about from drought to deluge, would occur and increase on a lineal basis up until the pole shift. Where this occurred steadily, it has only recently become undeniable. ZetaTalk, and only ZetaTalk, warned of these weather changes, at that early date. Our early warnings spoke to the issue of global heating from the core outward, hardly Global Warming, a surface or atmospheric issue, but caused by consternation in the core. Affected by the approach of Planet X, which was by then starting to zoom rapidly toward the inner solar system for its periodic passage, the core was churning, melting the permafrost and glaciers and riling up volcanoes. When the passage did not occur as expected in 2003 because Planet X had stalled in the inner solar system, we explained the increasing weather irregularities in the context of the global wobble that had ensued - weather wobbles where the Earth is suddenly forced under air masses, churning them. This evolved by 2005 into a looping jet stream, loops breaking away and turning like a tornado to affect the air masses underneath. Meanwhile, on Planet Earth, droughts had become more intractable and deluges positively frightening, temperature swings bringing snow in summer in the tropics and searing heat in Artic regions, with the violence of storms increasing in number and ferocity."

ZETATALK


From the ZetaTalk Chat Q&A for February 4, 2012:


The wobble seems to have changed, as the temperature in Europe suddenly plunged after being like an early Spring, Alaska has its coldest temps ever while the US and much of Canada is having an extremely mild winter. India went from fatal cold spell to balmy again. Has the Earth changed position vs a vs Planet X to cause this? [and from another] Bitter cold records broken in Alaska - all time coldest record nearly broken, but Murphy's Law intervenes [Jan 30] http://wattsupwiththat.com/2012/01/30/bitter-cold-records-broken-in-alaska Jim River, AK closed in on the all time record coldest temperature of -80°F set in 1971, which is not only the Alaska all-time record, but the record for the entire United States. Unfortunately, it seems the battery died in the weather station just at the critical moment. While the continental USA has a mild winter and has set a number of high temperature records in the last week and pundits ponder whether they will be blaming the dreaded "global warming" for those temperatures, Alaska and Canada have been suffering through some of the coldest temperatures on record during the last week.

There has been no change in the wobble pattern, the wobble has merely become more severe. Nancy noted a Figure 8 format when the Earth wobble first became noticeable, in early 2005, after Planet X moved into the inner solar system at the end of 2003. The Figure 8 shifted along to the east a bit on the globe between 2005 and 2009, (the last time Nancy took its measure) as Planet X came closer to the Earth, encountering the magnetic N Pole with a violent push earlier in the day. But the pattern of the Figure 8 remained essentially the same. So what changed recently that the weather patterns became noticeably different in late January, 2012?

The N Pole is pushed away when it comes over the horizon, when the noon Sun is centered over the Pacific. This regularly puts Alaska under colder air, with less sunlight, and thus the historically low temps there this January, 2012 as the wobble has gotten stronger. But by the time the Sun is positioned over India, the N Pole has swung during the Figure 8 so the globe tilts, and this tilt is visible in the weather maps from Asia. The tilt has forced the globe under the hot air closer to the Equator, warming the land along a discernable tilt demarcation line.

The next loop of the Figure 8 swings the globe so that the N Pole moves in the other direction, putting the globe again at a tilt but this time in the other direction. This tilt is discernable in weather maps of Europe, again along a diagonal line. Depending upon air pressure and temperature differences, the weather on either side of this diagonal line may be suddenly warm or suddenly cold. The tilt and diagonal line lingers to affect much of the US and Canada, but the Figure 8 changes at this point to be an up and down motion, pulling the geographic N Pole south so the US is experiencing a warmer than expected winter under a stronger Sun. Then the cycle repeats, with the magnetic N Pole of Earth pushed violently away again as the Sun is positioned over the Pacific.


From the ZetaTalk Chat Q&A for April 6, 2013:


Would the Zetas be able to let us know what is causing the early break-up of the Arctic Ice, the ice seems to have taken on a swirling pattern at the same time, would this be wobble related? [and from another] http://www.vancouversun.com/news/national/Canada+Arctic+cracks+spec... The ice in Canada’s western Arctic ripped open in a massive “fracturing event” this spring that spread like a wave across 1,000 kilometres of the Beaufort Sea. Huge leads of water – some more than 500 kilometres long and as much as 70 kilometres across – opened up from Alaska to Canada’s Arctic islands as the massive ice sheet cracked as it was pushed around by strong winds and currents. It took just seven days for the fractures to progress across the entire area from west to east. [and from another] http://earthobservatory.nasa.gov/IOTD/view.php?id=80752&src=iot... A high-pressure weather system was parked over the region, producing warmer temperatures and winds that flowed in a southwesterly direction. That fueled the Beaufort Gyre, a wind-driven ocean current that flows clockwise. The gyre was the key force pulling pieces of ice west past Point Barrow, the northern nub of Alaska that protrudes into the Beaufort Sea.


The Figure 8 formed by the N Pole during the daily Earth wobble has shifted somewhat to the East, due to Planet X positioned more to the right of the Earth during its approach. This was anticipated, and well described in ZetaTalk, the Earth crowding to the left in the cup to escape the approach of Planet X, so the angle between these two planets would change slightly. This shift of the Figure 8 to the East is due to the push against the Earth’s magnetic N Pole occurring sooner each day than prior. Thus instead of occurring when the Sun is high over the Pacific, over New Zealand, it is now occurring when the Sun is high over Alaska. All the wobble points have shifted eastward accordingly.

This has brought a lingering Winter to the western US, and a changed sloshing pattern to the Arctic waters. Instead of Pacific waters being pushed through the Bering Straits into the Arctic when the polar push occurs, the wobble is swinging the Arctic to the right, and then later to the left, creating a circular motion in the waters trapped in the Arctic. Since the Earth rotates counterclockwise, the motion also takes this path. This is yet another piece of evidence that the establishment is hard pressed to explain. They are attempting to ascribe this to high pressure and wind, all of which are not new to the Arctic, but this circular early breakup of ice in the Arctic is new.

Views: 629702

Comment

You need to be a member of Earth Changes and the Pole Shift to add comments!

Join Earth Changes and the Pole Shift

Comment by jorge namour on December 30, 2017 at 2:50pm

How cold is it? It's so cold that sharks are dying

December 30, 2017

http://edition.cnn.com/2017/12/29/weather/cold-weather-wrap-trnd/in...

It's so cold in Massachusetts that sharks are washing up on the shoreline of Cape Cod Bay. The Atlantic White Shark Conservancy said two thresher sharks were found Wednesday, "likely stranded due to cold shock."

Comment by KM on December 30, 2017 at 1:43pm

http://www.straitstimes.com/asia/tropics-not-spared-as-cold-snap-en...

Cold snap envelops parts of Asia

Above: Heavy snow in Beitun, in China's Xinjiang autonomous region, on Wednesday. Below: Rohingya refugees trying to stay warm at the Palongkhali refugee camp near Cox's Bazar in Bangladesh, on Sunday. In Myanmar, snow fell in the districts of Loilen Heavy snow in Beitun, in China's Xinjiang autonomous region, on Wednesday. 

Temperatures plunge in areas in Myanmar, Laos and Thailand; heavy snow hits Japan

Tropical South-east Asia has not been spared the wintry chills.

Thailand, Myanmar, Laos and Cambodia have been enveloped by an unexpectedly cold front, which descended from China last week.

In Samoeng, a district in the northern Thai province of Chiang Mai, the government distributed blankets and winter clothes to 7,000 residents last Friday as temperatures plunged to 5 deg C, The Nation newspaper reported.

Thailand's Meteorological Department has predicted that temperatures in areas, excluding the south, will drop by another 2 to 4 deg C during the New Year holidays.

People in parts of Myanmar were also shivering in temperatures as low as 3 deg C.

Snow fell in the districts of Loilen, Panglong and Pinlaung in the southern Shan state, where temperatures dropped to between 3 deg C and 5 deg C, residents told the Eleven newspaper. "Plantations have been destroyed," said villager Sai Tuu. She said older people, especially, were suffering in the cold snap.

Even elephants have had to be bundled up. At the Winga Baw camp for orphaned elephants in Bago, a region in Myanmar 90km north-east of Yangon, workers wrapped the seven pachyderms in their care with blankets.

"We haven't had weather this cold in 40 years," Ms Sangdeaun Lek Chailert, founder of the Save Elephant Foundation which runs the camp, told The New York Times on Sunday.

Meanwhile in Japan, heavy snow and strong winds continued to blanket the country's northern and central regions, broadcaster NHK said yesterday. The areas had seen up to 60cm of snow in the 24 hours starting Wednesday, and was expected to receive 40cm more by this morning, it added.

Weather officials warned of avalanches in some areas and said transport systems may be affected.

On the other side of Asia, severe cold weather coupled with dense fog blanketed many cities across Pakistan last week. At least 11 people were killed and 28 others injured last Thursday after a bus hit a trailer in Khanewal, Punjab province, due to low visibility.

A version of this article appeared in the print edition of The Straits Times on December 29, 2017, with the headline 'Tropics not spared as cold snap envelops parts of Asia'. 
Comment by KM on December 29, 2017 at 1:00pm

https://globalnews.ca/news/3937006/record-snowfall-for-central-okan...

Record snowfall for Central Okanagan

Travellers at Kelowna airport endure the snow.

Travellers at Kelowna airport endure the snow.

Global Okanagan


The Central Okanagan is on the verge of breaking a snowfall record that dates back several decades.

Environment Canada said the Central Okanagan has received 15-20 cm in the past 24 hours, approaching a record set in 1923.

“We will likely be setting a new record because some spots have received more than that,” Environment Canada meteorologist Allan Coldwells said.

He said some areas in West Kelowna received 20 cm and there’s more snow on the way.

Coldwells said that, although today’s heavy snowfall warning has ended, another winter blast will arrive in the Central Okanagan Friday.

“It shouldn’t be quite as intense as this one but still a pretty decent snowfall which should last through Friday night and taper off Saturday morning,” Coldwells said.

Meanwhile, a snow event has been declared and parking bans on snow routes are now in effect in Kelowna. The snow event advisory affects residents living on designated snow routes in Wilden, the Ponds, Magic Estates and Dilworth Mountain. Residents parked on the street have 24 hours to find alternative off-street parking.

Residents not living on a snow route are still encouraged to move their vehicles off the road to help plows clear the snow from curb to curb safely and quickly.

Vehicles that remain parked on snow routes during the temporary parking ban are subject to enforcement, up to and including a $50 fine or towing at the owner’s expense.

Comment by Gerard Zwaan on December 27, 2017 at 12:43pm

Lake-effect snowstorm hammers Erie, Pennsylvania shattering at least one all-time Pennsylvania snowstorm record and city records

A lake-effect snowband dumped over 4 feet of snow in Erie, Pennsylvania, in just over one day’s time. This shattered the city’s calendar-day snowfall record, on Christmas Day. Continuing into Tuesday, this also clobbered the previous state record two-day snowfall as Erie picked up more snow in 30 hours than their previous 13-day snowfall record. Officials declared a snow emergency for the city.

erie snowstorm, erie snowstorm pictures, erie snowstorm videos, erie snowstorm records, Erie snowstorm breaks records in Pennsylvania in on December 25-26 2017
Erie snowstorm breaks records in Pennsylvania in on December 25-26 2017. via Twitter

A stationary lake-effect snowband off Lake Erie dumped an incredible 34 inches of snow at Erie Airport on Christmas Day alone, quadrupling their previous record snowiest Christmas Day – 8.1 inches in 2002 – as well as smashing their all-time snowiest single day on record by over a foot – 20 inches on Nov. 11, 1956.

MediaCard--mediaForward customisable-border" data-scribe="component:card" dir="ltr" style="display: block;">

With an additional 3.5" of snow at the Erie, PA airport as of 5PM, this brings the two day (12/25-26) total up to 58" and the storm total (From 7PM Christmas Eve thru 5PM 12/26) up to 60.0". Heavy snow continues to fall. Here is a look at some of the records. 


That heavy snow continued into Tuesday, bringing their storm total since 7 p.m. EST Christmas Eve to an incredible 56.5 inches of snow – just over 4.5 feet – in 42 hours.

This prolific event shattered all previous multi-day snowfall records in Erie dating to 1893, according to the National Weather Service office in Cleveland, including:

  • Two-day snowfall: 26.7 inches (Nov. 24-25, 1950; the “Great Appalachian Storm”)
  • Three-day snowfall: 30.2 inches (Dec. 29-31, 2002)
  • Seven-day snowfall: 39.8 inches (Dec. 27, 2001 – Jan. 2, 2002)
  • 13-day snowfall: 52.8 inches (Dec. 31, 1998 – Jan. 12, 1999)

That’s not a misprint. Erie picked up more snow in less than 36 hours in this event than their previous 13-day snowstorm record.

Needless to say, the 92 inches of snow so far in December is the city’s snowiest single month on record, crushing the previous record of 66.9 inches in December 1989.

This wasn’t just a snowstorm record for the city, however.

According to the National Weather Service office in Cleveland, Erie also shattered the previous Pennsylvania state two-day snowstorm record of 44 inches set in Morgantown from March 20-21, 1958.

This northwest Pennsylvania city of just under 100,000 is used to heavy lake-effect snow, and is one of America’s snowiest cities, averaging 101 inches of snow a year.

However, picking up roughly the average December and January snowfall – 57.1 inches – in just over a day is something long-time residents have never seen before.

Put another way, Erie picked up more snow in this event than the yearly average snowfall in the following cities:

  • Minneapolis/St. Paul: 53.4 inches
  • Boston: 43.5 inches
  • Chicago: 37.1 inches

Meanwhile, a dangerous Arctic cold blast is to last into the first week of January 2018 in the Plains, Midwest and East. The extreme cold front is approaching the Midwest and Northeast and a severe cold protocol weather was activated in Connecticut Tuesday. Wind chills are expected to drop up to 30 degrees below zero. Although the outbreak may not break many daily records, this could be the coldest air of the season so far for some. Subzero temperatures are expected near the Canadian border.

erie snowstorm, erie snowstorm pictures, erie snowstorm videos, erie snowstorm records, Erie snowstorm breaks records in Pennsylvania in on December 25-26 2017
Erie snowstorm breaks records in Pennsylvania in on December 25-26 2017. Instagram

 
erie snowstorm, erie snowstorm pictures, erie snowstorm videos, erie snowstorm records, Erie snowstorm breaks records in Pennsylvania in on December 25-26 2017
Erie snowstorm breaks records in Pennsylvania in on December 25-26 2017. via Twitter

 
erie snowstorm, erie snowstorm pictures, erie snowstorm videos, erie snowstorm records, Erie snowstorm breaks records in Pennsylvania in on December 25-26 2017
Erie snowstorm breaks records in Pennsylvania in on December 25-26 2017. via VK

 
erie snowstorm, erie snowstorm pictures, erie snowstorm videos, erie snowstorm records, Erie snowstorm breaks records in Pennsylvania in on December 25-26 2017
Erie snowstorm breaks records in Pennsylvania in on December 25-26 2017. via VK

 
erie snowstorm, erie snowstorm pictures, erie snowstorm videos, erie snowstorm records, Erie snowstorm breaks records in Pennsylvania in on December 25-26 2017
Erie snowstorm breaks records in Pennsylvania in on December 25-26 2017. via VK

 
erie snowstorm, erie snowstorm pictures, erie snowstorm videos, erie snowstorm records, Erie snowstorm breaks records in Pennsylvania in on December 25-26 2017
Erie snowstorm breaks records in Pennsylvania in on December 25-26 2017. via VK

 
erie snowstorm, erie snowstorm pictures, erie snowstorm videos, erie snowstorm records, Erie snowstorm breaks records in Pennsylvania in on December 25-26 2017
Erie snowstorm breaks records in Pennsylvania in on December 25-26 2017. via VK

 
erie snowstorm, erie snowstorm pictures, erie snowstorm videos, erie snowstorm records, Erie snowstorm breaks records in Pennsylvania in on December 25-26 2017
Erie snowstorm breaks records in Pennsylvania in on December 25-26 2017. via Instagram

 
erie snowstorm, erie snowstorm pictures, erie snowstorm videos, erie snowstorm records, Erie snowstorm breaks records in Pennsylvania in on December 25-26 2017
Erie snowstorm breaks records in Pennsylvania in on December 25-26 2017. via Instagram

 
erie snowstorm, erie snowstorm pictures, erie snowstorm videos, erie snowstorm records, Erie snowstorm breaks records in Pennsylvania in on December 25-26 2017
Erie snowstorm breaks records in Pennsylvania in on December 25-26 2017. via Instagram

Another extreme cold weather event. They are increasing, aren’t they?

Soource: http://strangesounds.org/2017/12/lake-effect-snowstorm-hammered-eri...

Comment by jorge namour on December 26, 2017 at 5:41pm

Flight disruptions on fourth straight day in Dubai

United Arab Emirates
December 26, 2017

As of 12.30pm, some 148 flights were delayed, including arrivals and departures

http://gulfnews.com/news/uae/transport/flight-disruptions-on-fourth...

http://gulfnews.com/news/uae/transport/flight-disruptions-on-fourth...

A view of Shaikh Zayed road and Metro as foggy condition still prevails during the afternoon

Dubai: Another day of thick fog, another day of flight delays. Poor visibility due to dense fog caused flight disruptions for the fourth straight day in Dubai.
As of 12.30pm, some 148 flights were delayed, including arrivals and departures, and 11 were cancelled, according to flightradar24.com.

The day before, some 218 flights were delayed. The delay time is shorter now which is 15 minutes on average, compared to 78 minutes on Sunday.

Satellite image of the fog from the National Centre of Meteorology (NCM) at 7.45am showed the northern emirates, from Sharjah to Dubai and going inland covered in fog.
Some patches of the country were also shrouded white such as Fujairah and the islands in Abu Dhabi.

NCM on its official Twitter page also shared a time-lapse video by Khalid Al Hammadi that showed fog covering the Al Reem island’s skyline where only the top half of its buildings are visible

https://twitter.com/NCMS_media/status/945569894124392448/video/1

The national weather bureau said the fog usually dissipates by 11am. The fog warning is still up though relative humidity is expected to increase by as Tuesday night and Wednesday morning giving rise to fog or mist formation. CONTINUE...

Comment by jorge namour on December 18, 2017 at 3:19pm

Severe Weather Europe DECEMBER 18 2017

Change in snow cover in the last 10 days in Val Thorens, SE France

https://www.facebook.com/severeweatherEU/photos/a.1423656947857402....

Comment by Stanislav on December 18, 2017 at 1:38pm

Historic California wildfire continues to grow

GIS Data [1], California Department of Forestry and Fire Protection data [2], MODIS satellite Fire Information for Resource Management System (FIRMS) [3], D3.js linechart [6], D3.js barchart [7]

Firefighters monitor the Thomas fire as it burns through Los Padres National Forest near Ojai, Calif., on Friday, Dec. 8, 2017. (AP Photo/Noah Berger). Image source: naplesherald.com

"The attempt of the latest conspiracy theory to claim that the latest California fires in LA were incited by satellite microwave weapons is absurd, an attempt once again to claim, as we have stated, anything but Nibiru is the cause. Boy Scouts learn that to start a fire from kindling, one should blow gently on the small flame. This is because a source of oxygen is needed, and the constant winds provided by the daily Earth wobble bring that to LA. Do fires leap over spots, leaving them untouched to start on the other side? This is well known to firemen, who damp out sparks to prevent such propagation from a spark traveling in the wind."

ZetaTalk Chat Q&A for December 31, 2017

A day later, an astronaut on the International Space Station took a photograph (below) of smoke streaming west from the fires. The space station orbits roughly 248 miles (400 kilometers) above the surface. December 6, 2017. Image source: NASA Earth observatory Link

"16 December, 2017. California wildfire rages as 3rd largest recorded in state

Data source: California Department of Forestry and Fire Protection data [2]

A raging California wildfire on Saturday became the state's third largest blaze on record, with more devastation possible from a resurgence of the harsh winds that have fueled the deadly fire's growth.

Fire, smoke, and ash from the Thomas Fire, currently burning in the hills above Montecito, Summerland, and Carpinteria along the eastern edges of the county on December 13, 2017, in Santa Barbara, California. Photo by George Rose/Getty Images. Image source: newsweek.com

The so-called Thomas Fire has destroyed more than 1,000 structures, including about 750 homes, in coastal communities in Southern California since erupting on Dec. 4, the California Department of Forestry and Fire Protection said in a statement.

Firefighters at work as wildfires blaze in Santa Barbara county, California (Mike Eliason/AP). Image source: falmouthpacket.co.uk

The vast landscape charred by the blaze, which is centered less than 100 miles (161 km) northwest of downtown Los Angeles, reached 259,000 acres (104,813 hectares) early on Saturday, surpassing the 257,314 acres (104,131 hectares) destroyed by California's Rim Fire in 2013, authorities said. The Rim Fire had been the third-largest blaze on record in the state." [5]

Strong wind is a significant cause of the current historical forest fires:

"7 December, 2017. Record-breaking winds spell danger as California fires rage: 'There will no ability to fight fires'

Santa Barbara County Fire Department, a wind speed indicator held by a US Forest Service fire fighter. Photo: MIKE ELIASON. Image source: smh.com.au

Southern California has felt yellow wind, orange wind, and red wind. But never purple wind. Until now. The colour-coded system showing the expected strength of the winds driving the region’s fierce wildfires has reached uncharted territory, pushing past red, which means “high” into the colour that means “extreme.” “The forecast for tomorrow is purple,” said Ken Pimlott, director at the California Department of Forestry and Fire Protection. “We’ve never used purple before.”" [4]

References:

[1] http://www.naturalearthdata.com

[2] http://cdfdata.fire.ca.gov/incidents/incidents_statsevents

[3] https://firms.modaps.eosdis.nasa.gov/download/

[4] Press, T. A., & Amanda Lee Myers And Andrew Dalton. (2017, December 07). Record-breaking winds spell danger as California fires rage: ‘There will no ability to fight fires’. Retrieved December 18, 2017, from http://nationalpost.com/news/world/california-wind-and-fire-danger-... 

[5] Dobuzinskis, A. (2017, December 16). California wildfire rages as 3rd largest recorded in state. Retrieved December 18, 2017, from https://www.aol.com/article/news/2017/12/16/california-wildfire-rag... 

[6] D3.js linechart: dualmultilincechart.html; datadual; (Based on this example: http://bl.ocks.org/d3noob/e34791a32a54e015f57d)

[7] D3.js barchart: barchart.html; data.csv; (Based on this example: http://bl.ocks.org/d3noob/8952219)

Comment by KM on December 17, 2017 at 11:52pm

Source

Weather anomalies are spreading across the world: Coldest summer for 100 years in Queensland, Australia, Earliest ice formation in 71 years on the Han River, South Korea, 3.5 meters of snow in Germany

The weather is going crazy around the world, breaking almost every week a new extreme event record. Here three examples of weather anomalies recorded these days around the world:

More than 1.5 meters of fresh snow and 3.5 meters (11.5 feet) of snow accumulation were recorded on The Brocken, also known as the Blocksberg, the highest peak of the Harz mountain range and also the highest peak of Northern Germany culminating at 1,141 metres (3,743 ft):

snow brocken germany, huge snow accumulation brocken germany, Snow drift up to 3.5 meters were reported at Brocken in Germany on December 16 2017
Snow dead-end at Brocken in Germany. Lucas Steinhoff via Twitter

snow brocken germany, huge snow accumulation brocken germany, Snow drift up to 3.5 meters were reported at Brocken in Germany on December 16 2017
Snow drift up to 3.5 meters (11.5 feet) were reported at Brocken in Germany on December 16, 2017. Lucas Steinhoff via Twitter

snow brocken germany, huge snow accumulation brocken germany, Snow drift up to 3.5 meters were reported at Brocken in Germany on December 16 2017
Snow accumulation up to 3.5 meters (11.5 feet) were reported at Brocken in Germany on December 16, 2017. Lucas Steinhoff via Twitter

snow brocken germany, huge snow accumulation brocken germany, Snow drift up to 3.5 meters were reported at Brocken in Germany on December 16 2017
Must have been difficult to open the doors with this snow drift! Lucas Steinhoff via Twitter

snow brocken germany, huge snow accumulation brocken germany, Snow drift up to 3.5 meters were reported at Brocken in Germany on December 16 2017
Depth of the snow reaches 1.5 meters and snow accumulation made walls taller than 3.5 meters at Brocken, Germany on December 16, 2017. Lucas Steinhoff via Twitter

snow brocken germany, huge snow accumulation brocken germany, Snow drift up to 3.5 meters were reported at Brocken in Germany on December 16 2017
Even the tractor is smaller than the wall of snow in Brocken, Germany. Lucas Steinhoff via Twitter

The next event is actually good news for the next winter olympics – although they are still far away. After five days of extreme cold weather, ice has formed on the Han River in Seoul, South Korea.

han river ice seoul, han river ice seoul december 2017
Earliest ice formation in 71 years covers the Han River in Seoul, South Korea on December 14, 2017. via Sott

And this ICE is the first ice formation on the river before Dec. 15 in 71 years. Last time such a phenomenon occurred was on December 12, 1946.

While Finally, normally very hot, the current summer in Queensland, Australia breaks record lows with temperatures dropping to 11 degrees Celsius below average, which is, even for forecasters, a “very unusual” phenomenon. Mount Isa had its lowest overnight December temperate ever on record at 12 degrees Celsius – 11C degrees below average. Burketown had a minimum of 17.7C which was the lowest they’d seen up there since 1920, but that was eclipsed today with 16C, and that’s the coldest December morning since 1907. Richmond yesterday was 11.8C which was the lowest there in December since 1909. And of course the reason behind this anomaly is unknown!

I would just like to add videos about some other strange weather events going on these last few days:

Aerial footage captured images of the Chilean village of Villa Santa Lucia buried beneath a thick layer of mud on Saturday, following a deadly landslide which killed at least five people:

Third-largest wildfires in history spread across Southern California… And it is just 30% contained!:

Stromboli eruption on December 15, 2017:

After hail and thunderstorms engulged the United Arab Emirates and Oman y..., now impressive floods are engulfing the north of the country:

Keep safe!

Comment by SongStar101 on December 13, 2017 at 8:10am

Italy: helicopters ferry flood victims to safety

http://www.foxnews.com/world/2017/12/12/italy-helicopters-ferry-flo...

Italian firefighters used helicopters and rubber dinghies to evacuate stranded residents of a town in the northern region of Emilia Romagna that flooded when waters overran earthen dikes.

Video provided by firefighters Tuesday shows houses under water after the Enza River flooded its reinforced banks in the town of Lentigione. The news agency ANSA said about 1,000 people were evacuated, but a woman who answered the phone at the city hall was unable to confirm the numbers.

Firefighters also rescued three people and a dog with a rubber dinghy from the town of Colorno when the Parma river flooded.

Heavy rain and snow fall has hampered travel in stretches of northern Italy, with trains severely delayed between the coastal city of Genoa and Milan.

Comment by KM on December 12, 2017 at 1:20pm

http://www.dailymail.co.uk/news/article-5169625/Apocalyptic-mushroo...

Giant smoke-generated mushroom cloud above California mountains causes huge updraft and threatens to spread wildfires even further as devastated area is now larger than NYC and Boston COMBINED

  • The Pyrocumulus cloud, which resembled an erupting volcano or a nuclear bomb, was seen above the San Ynez Mountains of western Ventura County in the Los Padres National Forest, near Santa Barbara
  • The weather phenomenon, also known as a fire cloud, stretched up almost 30,000 feet high
  •  Eric Boldt, a forecaster with the National Weather Service, said it's similar to a thunderstorm and could be responsible for helping spread the Thomas Wildfire
  • On Sunday, the Calfire grew 50,000 acres to 230,000 acres. It is now the fifth worst fire in Californian history
  • Thousands of firefighters were battling the blaze on Monday as it crept relentlessly up the Pacific coast and forced new evacuations 

An ominous mushroom cloud was spotted above California Monday as one of the most destructive wildfires in the state's history crept relentlessly up the Pacific coast.

The weather phenomenon, which resembled an erupting volcano or a nuclear bomb, was seen above the San Ynez Mountains of western Ventura County in the Los Padres National Forest, near Santa Barbara.

The billowing Pyrocumulus cloud, also known as a fire cloud, stretched up almost 30,000 feet high.

Eric Boldt, a forecaster with the National Weather Service office in Oxnard, told San Francisco Gate that the cloud was created by similar forced to a thunderstorm - and its strong winds could be responsible for helping spread the Thomas Wildfire on Sunday as Calfire grew 50,000 acres to 230,000 acres. It is now the fifth worst fire in Californian history. 

The weather phenomenon, which resembled an erupting volcano or a nuclear bomb, was seen above the San Ynez Mountains of western Ventura County in the Los Padres National Forest, near Santa Barbara

The weather phenomenon, which resembled an erupting volcano or a nuclear bomb, was seen above the San Ynez Mountains of western Ventura County in the Los Padres National Forest, near Santa Barbara

An apocalyptic mushroom cloud was spotted above California Monday as one of the most destructive wildfires in the state's history crept relentlessly up the Pacific coast

An apocalyptic mushroom cloud was spotted above California Monday as one of the most destructive wildfires in the state's history crept relentlessly up the Pacific coast

'When we see these clouds billowing so tall, it's the same mechanisms that are happening with a thunderstorm,' he said. 

'You're causing updrafts and air that's pushing the smoke higher. It creates its own wind. If it starts to spin, that's where you can get more wind and fast-moving progression of the fire. It can become a dangerous situation for firefighters.'

Thousands of firefighters were battling the blaze on Monday as it crept relentlessly up the Pacific coast and forced new evacuations.

As a wildfire near Los Angeles was brought under control, fire crews were being redeployed to battle the Thomas Fire northwest of America's second-largest city.

Fixed-wing aircraft and helicopters were assisting nearly 6,400 firefighters trying to keep the Thomas Fire away from beachfront towns south of the historic city of Santa Barbara, the California Fire Department (Cal Fire) said.


SEARCH PS Ning or Zetatalk

 
Search:

This free script provided by
JavaScript Kit

Donate

Donate to support Pole Shift ning costs. Thank you!

© 2025   Created by 0nin2migqvl32.   Powered by

Badges  |  Report an Issue  |  Terms of Service