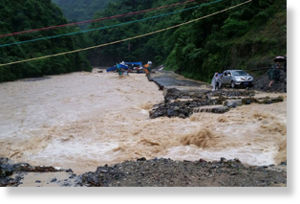
"We warned at the start of ZetaTalk, in 1995, thatunpredictable weather extremes, switching about from drought to deluge,would occur and increase on a lineal basis up until the pole shift. Where this occurred steadily, it has only recently become undeniable. ZetaTalk, and only ZetaTalk, warned of these weather changes, at that early date. Our early warnings spoke to the issue of global heating from the core outward, hardly Global Warming, a surface or atmospheric issue, but caused by consternation in the core. Affected by the approach of Planet X, which was by then starting to zoom rapidly toward the inner solar system for its periodic passage, the core was churning, melting the permafrost and glaciers and riling up volcanoes. When the passage did not occur as expected in 2003 because Planet X had stalled in the inner solar system, we explained the increasing weather irregularities in the context of the global wobble that had ensued - weather wobbles where the Earth is suddenly forced under air masses, churning them. This evolved by 2005 into a looping jet stream, loops breaking away and turning like a tornado to affect the air masses underneath. Meanwhile, on Planet Earth, droughts had become more intractable and deluges positively frightening, temperature swings bringing snow in summer in the tropics and searing heat in Artic regions, with the violence of storms increasing in number and ferocity."
The wobble seems to have changed, as the temperature in Europe suddenly plunged after being like an early Spring, Alaska has its coldest temps ever while the US and much of Canada is having an extremely mild winter. India went from fatal cold spell to balmy again. Has the Earth changed position vs a vs Planet X to cause this?[and from another]Bitter cold records broken in Alaska - all time coldest record nearly broken, but Murphy's Law intervenes[Jan 30]http://wattsupwiththat.com/2012/01/30/bitter-cold-records-broken-in-alaskaJim River, AK closed in on the all time record coldest temperature of -80°F set in 1971, which is not only the Alaska all-time record, but the record for the entire United States. Unfortunately, it seems the battery died in the weather station just at the critical moment. While the continental USA has a mild winter and has set a number of high temperature records in the last week and pundits ponder whether they will be blaming the dreaded "global warming" for those temperatures, Alaska and Canada have been suffering through some of the coldest temperatures on record during the last week.
There has been no change in the wobble pattern, the wobble has merely become more severe. Nancy noted a Figure 8 format when the Earth wobble first became noticeable, in early 2005, after Planet X moved into the inner solar system at the end of 2003. The Figure 8 shifted along to the east a bit on the globe between 2005 and 2009, (the last time Nancy took its measure) as Planet X came closer to the Earth, encountering the magnetic N Pole with a violent push earlier in the day. But the pattern of the Figure 8 remained essentially the same. So what changed recently that the weather patterns became noticeably different in late January, 2012?
The N Pole is pushed away when it comes over the horizon, when the noon Sun is centered over the Pacific. This regularly puts Alaska under colder air, with less sunlight, and thus the historically low temps there this January, 2012 as the wobble has gotten stronger. But by the time the Sun is positioned over India, the N Pole has swung during the Figure 8 so the globe tilts, and this tilt is visible in the weather maps from Asia. The tilt has forced the globe under the hot air closer to the Equator, warming the land along a discernable tilt demarcation line.
The next loop of the Figure 8 swings the globe so that the N Pole moves in the other direction, putting the globe again at a tilt but this time in the other direction. This tilt is discernable in weather maps of Europe, again along a diagonal line. Depending upon air pressure and temperature differences, the weather on either side of this diagonal line may be suddenly warm or suddenly cold. The tilt and diagonal line lingers to affect much of the US and Canada, but the Figure 8 changes at this point to be an up and down motion, pulling the geographic N Pole south so the US is experiencing a warmer than expected winter under a stronger Sun. Then the cycle repeats, with the magnetic N Pole of Earth pushed violently away again as the Sun is positioned over the Pacific.
Would the Zetas be able to let us know what is causing the early break-up of the Arctic Ice, the ice seems to have taken on a swirling pattern at the same time, would this be wobble related?[and from another]http://www.vancouversun.com/news/national/Canada+Arctic+cracks+spec... The ice in Canada’s western Arctic ripped open in a massive “fracturing event” this spring that spread like a wave across 1,000 kilometres of the Beaufort Sea. Huge leads of water – some more than 500 kilometres long and as much as 70 kilometres across – opened up from Alaska to Canada’s Arctic islands as the massive ice sheet cracked as it was pushed around by strong winds and currents. It took just seven days for the fractures to progress across the entire area from west to east.[and from another]http://earthobservatory.nasa.gov/IOTD/view.php?id=80752&src=iot... A high-pressure weather system was parked over the region, producing warmer temperatures and winds that flowed in a southwesterly direction. That fueled the Beaufort Gyre, a wind-driven ocean current that flows clockwise. The gyre was the key force pulling pieces of ice west past Point Barrow, the northern nub of Alaska that protrudes into the Beaufort Sea.
The Figure 8 formed by the N Pole during the daily Earth wobble has shifted somewhat to the East, due to Planet X positioned more to the right of the Earth during its approach. This was anticipated, and well described in ZetaTalk, the Earth crowding to the left in the cup to escape the approach of Planet X, so the angle between these two planets would change slightly. This shift of the Figure 8 to the East is due to the push against the Earth’s magnetic N Pole occurring sooner each day than prior. Thus instead of occurring when the Sun is high over the Pacific, over New Zealand, it is now occurring when the Sun is high over Alaska. All the wobble points have shifted eastward accordingly.
This has brought a lingering Winter to the western US, and a changed sloshing pattern to the Arctic waters. Instead of Pacific waters being pushed through the Bering Straits into the Arctic when the polar push occurs, the wobble is swinging the Arctic to the right, and then later to the left, creating a circular motion in the waters trapped in the Arctic. Since the Earth rotates counterclockwise, the motion also takes this path. This is yet another piece of evidence that the establishment is hard pressed to explain. They are attempting to ascribe this to high pressure and wind, all of which are not new to the Arctic, but this circular early breakup of ice in the Arctic is new.
In the south-western Pacific Ocean revives the season of storms and tropical cyclones. In fact, just recently, in the stretch of ocean to the east of the Solomon Islands, we have witnessed the formation of tropical storm "Pam",
In a few hours, "Pam", passing over a stretch of ocean very hot, with low values of "Wind Shear" at higher altitudes (ideal environmental conditions for the deepening of a tropical cyclone) is likely to intensify significantly, transforming by the end of the day in a tropical cyclone 1st category of the Saffir-Simpson, with moderate winds sustained at over 120-130 km / h and gusts spike over the 140-150 km / h.
Hence the storm will follow a very dangerous path, since moving over a vast stretch of sea very warm, and able to provide huge amounts of latent heat that will test the agreement on all sides of the cyclonic circulation, will be further explored, with a significant thickening the "horizontal pressure gradient" that will make more and more intense and stormy winds around the area disturbed. It will be well known to activate the process of "self-supply" characteristic of tropical cyclones, with constant suction of air masses very hot and humid, maritime, from the nearby suburbs, which in addition to detonate the Convention in the central part of the system , will help develop impressive bands cloudy spiral that will be fueled by the huge amount of water vapor sucked from the warm surface waters of the southwest Pacific, whose temperatures are around + 28 ° C + 29 ° C.
The storm should also take the size really considerable, given the aspiration of large amounts of latent heat from the Southwest Pacific.
Typically, in these conditions, with a very damp in the lower layers and a "Wind Shear" very weak at higher altitudes of the troposphere, the process of "self-supply", not finding obstacles, intensified so as to deepen the cyclone, which in all probability by tomorrow and Thursday will reach the 2nd or even 3rd category of the Saffir-Simpson, with moderate winds incurred that exceed the threshold of 150-160 km / h around the deep minimum baric ground . Many models, including GFS, prognosticano the storm, because of the process of "self-supply", may even evolve into a dangerous tropical cyclone of the 4th category Saffir-Simpson, that between Thursday and Friday will pass just east of Vanuatu and the Loyalty Islands.
Given the considerable intensity only flyby of the central core of "Pam" threatens to expose the Loyalty Islands
The cyclonic winds that blow stormy so furious around the eye of the tropical cyclone, however, raise an intense waves up to more than 6-7 meters , locally even more central in the area around the eye, which can trigger intense storms on the southern and eastern coasts of the islands of Loyalty.
The evolution of "Pam" from tropical storm to tropical cyclone 1st category Saffir-Simpson
Comment by Jorge Mejia on March 11, 2015 at 4:48am
Arctic Sea Ice Maximum For 2015
Unless something weird happens, the Arctic may have set its maximum way back on day 53.
It would be the lowest maximum in the satellite era.
“It’s official,” says meteoweb.eu. “Capracotta and Pescocostanzo, Italy, are the snowiest places in the world! The data is scary.”
256cm (8.34 ft) of snow Capracotta (which lies at 1,421 meters in the province of Isernia),
240cm (7.84 ft) in Pescocostanzo (which lies at 1,395 meters in the province of L’Aquila):
These are the two new records for snowfall in a span of only 24 hours, that is, in one day, although in reality all this snow fell in about 18 hours on Thursday, March 5, 2015.
And at higher altitudes, accumulations are much more significant. The previous world record snowfall most snow in 24 hours was set in Silver Lake, Colorado, where between 20 and April 21, 1921 fell 193cm (6.33 ft) of snow in 24 hours. But surely between Abruzzo and Molise it has snowed more than this many times. The great meteorologist Edmondo Bernacca wrote in the Italian Meteorological Magazine of December 1961 that in Roccacaramanico, in the municipality of Sant’Eufemia, just 878 meters above sea level in the province of Pescara, fell 365cm (11.92 ft) of snow in 24 hours.
In two areas in the Apennines between Abruzzo and Molise men and equipment are still working to clear the roads between the houses, which were inundated with piles of snow that reached three meters (10 ft) because of the wind, which blew impetuous during the storm. In Pescocostanzo during the storm it was virtually impossible to get out of the house!
It should be stressed that the Apennine area between Abruzzo and Molise is not new to this type of snowfall, as over the years there have been several accumulations similar to this event. It has been handed down in the annals of meteorology and manuals from generation to generation, that this is the snowiest area in the world in terms of abundance of snowfall in a short time because of the proximity to the sea, exposure north / east and the topography of the area.
South Lake Tahoe, Calif. — Despite a weekend storm, the snowpack at Phillips Station remains near record lows.
Snow depths were near the levels recorded by the Department of Water Resources during the drought of 1991.
“We’re kind of hovering … nudging up against the lowest snowpack on record,” said California Cooperative Snow Surveys Program Chief Frank Gehrke on Tuesday. “In general, conditions are very grim. We’re just not going to get significant storm activity to bring us out of the drought.”
Readings were near where they were in March 1991, the last drought resembling this one. It was the second lowest reading since 1950, according to the department.
March 1, 1991, saw a blizzard hit the Sierra Nevada, which continued the next two days, bringing 50 inches of powder to Tahoe’s ski resorts. From then on that month came to be known as “Miracle March.”
“In ’91 we had a very good March,” Gehrke said. “But it doesn’t seem as though that’s going to happen this year,”
Last weekend’s snowfall, roughly 13 inches accumulated below 7,000 feet, and as much as 15 inches above that, did not save the day. Phillips station recorded 0.9 inches of water content in the snow, which represents 5 percent of the March 3 historical average for the site. None of the other three stations included in the report recorded more than 1.5 inches of water content or 6 percent of the long-term average.
The impact of the snowstorm the region saw last weekend will likely be, for the most part, insignificant. Most of the water content that came from the storm will likely soak into the ground and will yield little runoff, Gehrke said.
“The best we can hope for is some storm activity to at least give us a little bit of an increase in runoff from what were seeing with this extremely shallow snowpack that we have right now.”
The winter started well, with a relatively wet December that allowed the department to transport some water, but climate returned to the dry pattern that has been developing during the past four years.
In South Lake Tahoe, January was virtually dry, with only 0.1 inches of precipitation, and February only yielded 4.25 inches.
The weekend’s storm recorded 0.8 inches of precipitation.
Warm temperatures, which cause snow to melt faster, have also not helped. In February, 13 days set the record for high temperatures. January had four record-setting days. Additionally, both months also recorded their warmest days on record, 66 degrees on Jan. 25 and 65 degrees on Feb. 13.
In other parts of the Sierra, the readings were not as dismal. The central and southern Sierra readings were 5.5 inches (20 percent of average) and 5 inches (22 percent) respectively.
Statewide, 103 electronic sensors found Tuesday’s snow water equivalent to be 5 inches, 19 percent of the March 3 multi-decade average. When department conducted the season’s first two manual surveys on Dec. 30 and Jan. 29, the statewide water content was 50 percent and 25 percent respectively of the historical averages for those dates.
Weeks of spring-like weather then produced more rain than snow when storms did arrive during California’s warmest winter on record, the press release read. California’s historically wettest winter months have already passed, and it’s almost certain the state will be in drought throughout 2015, for the fourth consecutive year.
“Unless this month approximates the 1991 “Miracle March” with significantly more precipitation than normal, the traditional wet season will end on April 1 with an alarmingly low amount of water stored in the mountains as snow,” according to the department.
Drought-stricken California, which just had its driest January ever recorded, smashed another dismal record last month: the hottest February.
Peter Gleick, a climate, water and sustainability scientist and member of the U.S. National Academy of Science, tweeted a graph from the National Oceanic and Atmospheric Administration on Friday, pointing out the shocking data point. February's heat topped all previous Februaries since the agency began collecting weather information in 1895.
The chart comes from a NOAA tool that allows users to plot weather over time and compare the temperatures from the same months in different years. According to the data, California's average temperature last month was 53.3 degrees, one degree higher than the second-warmest February on record in 1963, and 1.5 degrees higher than the third-warmest in 1991.
The causes of the California drought remain hotly contested and impossible to prove for now. NASA explains that two main contributors to any drought generally are changes in land and sea surface temperatures, and soil moisture content.When soil is dry, it leads to higher temperatures, making drought self-sustaining.
Cold weather: Snow on the beach, plus waterspouts near Los Angeles
Yes you read that headline correctly. Yesterday in Huntington Beach there was snow. And, in Redondo Beach, waterspouts were reported. I’m sure it won’t be long before somebody tries to blame these weather events on “global warming” which is fast becoming the “universal bogeyman” for any weather event.
These events were all part of a frontal system moving through, hardly unprecedented. It seems there was a similar event with snow on the beach in 1987.
Observers indicated the snow might be very fine hail, possibly from a cold core thunderstorm. Whatever it is, it has nothing to do with “global warming”.
Hundreds of stranded drivers forced to FORAGE for food after being stuck in thick snow on Kentucky highway for more than 12 HOURS in 2,000 mile wide winter storm
A treacherous winter storm reaching from Texas to New England closed schools, canceled more than 4,000 flights
Hundreds of drivers were stranded overnight in Kentucky, where as much as 23 inches of snow fell
Kentucky Governor Steve Beshear declared a state of emergency on Thursday
A Delta Air Lines plane arriving in heavy snow at New York's LaGuardia Airport from Atlanta slid off the runway into a fence
Boston needs two more inches to break its record annual snowfall in a year
Meteorologist at Weather Bell Analytics, said cities including Waco, Texas; Chicago, Memphis and Cleveland should expect record cold Friday morning
A treacherous winter storm reaching from Texas to New England closed schools, canceled more than 4,000 flights and stranded hundreds of drivers overnight in Kentucky, where as much as 23 inches of snow fell.
The snow has caused traffic to come to a standstill and a huge section of the freeway between Elizabethtown and Louisville has become a virtual parking lot - leaving cars and trucks littered across the roads since 10pm last night.
Desperate for food, some of those stuck in the 50 mile jam have taken to foraging on the side of the road for food and Kentucky Governor Steve Beshear has declared a state of emergency.
'Help is on the way,' Kentucky National Guard Lieutenant Colonel Kirk Hilbrecht, interviewed on CNN, told drivers stuck overnight in their cars on I-65 and I-24.
Scroll Down for Video
Clear on one side only: A vehicle sits in the median of Interstate 24 as drivers wait after being stranded between Eddyville and Cadiz in Kentucky
The National Guard was deployed to rescue the motorists, taking them to warm shelters and giving diabetic travelers insulin, Hilbrecht said.
Besides the cars, at least 200 tractor trailers were stuck on the impassable roadway, said Kentucky State Police Trooper Jeff Gregory.
Kaleigh Birman said she was headed from Michigan to Florida for a spring break holiday with her family when her carload of six people and two dogs got stuck overnight on I-65.
'We swerved in and out of parked cars,' Birman told Reuters in a Twitter post, noting that the accumulation became so heavy it forced her car to a standstill, too. 'I'm pretty sure everyone is running out of gas.'
National Weather Service meteorologist Andrew Orrison said Kentucky was buried under snow, with 23 inches reported in Baizetown and more than a foot falling elsewhere in the state.
Backlog: Traffic backs up as more than 50 miles of Interstate 65 southbound is shut down from the weather on Thursday in Kentucky as huge a huge snow storm hit 30 states
Comment by jorge namour on March 5, 2015 at 11:09am
ITALY - Bad weather, total destruction at the center / north: wind to over 200km / h, "do not leave home" [PHOTOS]
Dramatic situation for the strong wind in Liguria and Tuscany: serious damage, the authorities closed schools and give formal notice to citizens "do not go out of the house absolutely"
Dramatic situation because of the strong wind blowing over Italy, especially in the center / north and Sardinia. Many places of Liguria and Tuscany have exceeded 130km / h, with peaks of over sensational 200km / h as if Italy was crossed by a hurricane in the third category on the Saffir-Simpson scale . The damage is very serious: thousands of trees felled, even total destruction to many homes and structures of various kinds. Firefighters are at work and have received hundreds of requests for help. Many mayors have decided in the morning to close schools, alerting the population with finality: "do not leave home for no reason."
The city most affected is Florence, with winds from the record: 172km / h at the weather station of Terzolina, 154km / h in Rifredi, but the flurry stronger until the time was even 209km / h in Gigliana, village of Filattiera, common the province of Massa Carrara and the Apuan Alps.
The strongest winds are in fact those of the north / east in areas downwind of the findings with respect to the cyclone positioned in the central Tyrrhenian. Despite the minimum baric is not very deep (1001hPa), the pressure gradient is scary, with almost 1030hPa Alps and the resultant cyclonic winds raging. And 'frightening picture that comes from Pistoia, with Piazza del Carmine unrecognizable
The strong wind will continue to blow impetuous until Saturday, although attenuated compared to these crazy speeds. But watch out for the whole day today in Sardinia and Sicily, and in the Adriatic between Marche and Abruzzo. To monitor the situation live, here are the pages of the nowcasting of MeteoWeb:
You need to be a member of Earth Changes and the Pole Shift to add comments!
Join Earth Changes and the Pole Shift