Wild Weather, the Wobble Effect
|
Weather: |
Tides and Whirlpools:
|
"We warned at the start of ZetaTalk, in 1995, that unpredictable weather extremes, switching about from drought to deluge, would occur and increase on a lineal basis up until the pole shift. Where this occurred steadily, it has only recently become undeniable. ZetaTalk, and only ZetaTalk, warned of these weather changes, at that early date. Our early warnings spoke to the issue of global heating from the core outward, hardly Global Warming, a surface or atmospheric issue, but caused by consternation in the core. Affected by the approach of Planet X, which was by then starting to zoom rapidly toward the inner solar system for its periodic passage, the core was churning, melting the permafrost and glaciers and riling up volcanoes. When the passage did not occur as expected in 2003 because Planet X had stalled in the inner solar system, we explained the increasing weather irregularities in the context of the global wobble that had ensued - weather wobbles where the Earth is suddenly forced under air masses, churning them. This evolved by 2005 into a looping jet stream, loops breaking away and turning like a tornado to affect the air masses underneath. Meanwhile, on Planet Earth, droughts had become more intractable and deluges positively frightening, temperature swings bringing snow in summer in the tropics and searing heat in Artic regions, with the violence of storms increasing in number and ferocity."
From the ZetaTalk Chat Q&A for February 4, 2012:
The wobble seems to have changed, as the temperature in Europe suddenly plunged after being like an early Spring, Alaska has its coldest temps ever while the US and much of Canada is having an extremely mild winter. India went from fatal cold spell to balmy again. Has the Earth changed position vs a vs Planet X to cause this? [and from another] Bitter cold records broken in Alaska - all time coldest record nearly broken, but Murphy's Law intervenes [Jan 30] http://wattsupwiththat.com/2012/01/30/bitter-cold-records-broken-in-alaska Jim River, AK closed in on the all time record coldest temperature of -80°F set in 1971, which is not only the Alaska all-time record, but the record for the entire United States. Unfortunately, it seems the battery died in the weather station just at the critical moment. While the continental USA has a mild winter and has set a number of high temperature records in the last week and pundits ponder whether they will be blaming the dreaded "global warming" for those temperatures, Alaska and Canada have been suffering through some of the coldest temperatures on record during the last week.

There has been no change in the wobble pattern, the wobble has merely become more severe. Nancy noted a Figure 8 format when the Earth wobble first became noticeable, in early 2005, after Planet X moved into the inner solar system at the end of 2003. The Figure 8 shifted along to the east a bit on the globe between 2005 and 2009, (the last time Nancy took its measure) as Planet X came closer to the Earth, encountering the magnetic N Pole with a violent push earlier in the day. But the pattern of the Figure 8 remained essentially the same. So what changed recently that the weather patterns became noticeably different in late January, 2012?
The N Pole is pushed away when it comes over the horizon, when the noon Sun is centered over the Pacific. This regularly puts Alaska under colder air, with less sunlight, and thus the historically low temps there this January, 2012 as the wobble has gotten stronger. But by the time the Sun is positioned over India, the N Pole has swung during the Figure 8 so the globe tilts, and this tilt is visible in the weather maps from Asia. The tilt has forced the globe under the hot air closer to the Equator, warming the land along a discernable tilt demarcation line.
The next loop of the Figure 8 swings the globe so that the N Pole moves in the other direction, putting the globe again at a tilt but this time in the other direction. This tilt is discernable in weather maps of Europe, again along a diagonal line. Depending upon air pressure and temperature differences, the weather on either side of this diagonal line may be suddenly warm or suddenly cold. The tilt and diagonal line lingers to affect much of the US and Canada, but the Figure 8 changes at this point to be an up and down motion, pulling the geographic N Pole south so the US is experiencing a warmer than expected winter under a stronger Sun. Then the cycle repeats, with the magnetic N Pole of Earth pushed violently away again as the Sun is positioned over the Pacific.
From the ZetaTalk Chat Q&A for April 6, 2013:
Would the Zetas be able to let us know what is causing the early break-up of the Arctic Ice, the ice seems to have taken on a swirling pattern at the same time, would this be wobble related? [and from another] http://www.vancouversun.com/news/national/Canada+Arctic+cracks+spec... The ice in Canada’s western Arctic ripped open in a massive “fracturing event” this spring that spread like a wave across 1,000 kilometres of the Beaufort Sea. Huge leads of water – some more than 500 kilometres long and as much as 70 kilometres across – opened up from Alaska to Canada’s Arctic islands as the massive ice sheet cracked as it was pushed around by strong winds and currents. It took just seven days for the fractures to progress across the entire area from west to east. [and from another] http://earthobservatory.nasa.gov/IOTD/view.php?id=80752&src=iot... A high-pressure weather system was parked over the region, producing warmer temperatures and winds that flowed in a southwesterly direction. That fueled the Beaufort Gyre, a wind-driven ocean current that flows clockwise. The gyre was the key force pulling pieces of ice west past Point Barrow, the northern nub of Alaska that protrudes into the Beaufort Sea.
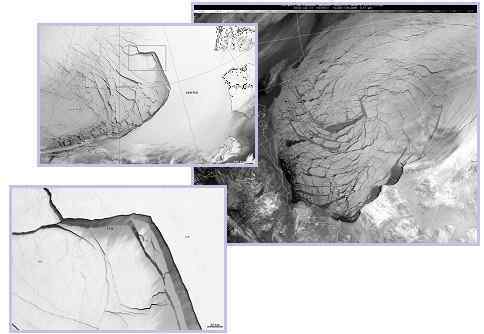
The Figure 8 formed by the N Pole during the daily Earth wobble has shifted somewhat to the East, due to Planet X positioned more to the right of the Earth during its approach. This was anticipated, and well described in ZetaTalk, the Earth crowding to the left in the cup to escape the approach of Planet X, so the angle between these two planets would change slightly. This shift of the Figure 8 to the East is due to the push against the Earth’s magnetic N Pole occurring sooner each day than prior. Thus instead of occurring when the Sun is high over the Pacific, over New Zealand, it is now occurring when the Sun is high over Alaska. All the wobble points have shifted eastward accordingly.
This has brought a lingering Winter to the western US, and a changed sloshing pattern to the Arctic waters. Instead of Pacific waters being pushed through the Bering Straits into the Arctic when the polar push occurs, the wobble is swinging the Arctic to the right, and then later to the left, creating a circular motion in the waters trapped in the Arctic. Since the Earth rotates counterclockwise, the motion also takes this path. This is yet another piece of evidence that the establishment is hard pressed to explain. They are attempting to ascribe this to high pressure and wind, all of which are not new to the Arctic, but this circular early breakup of ice in the Arctic is new.
Views: 630668
Comment
-
Comment by Derrick Johnson on April 11, 2013 at 9:06am
-
Denver weather sets record low temperature
Denver tied a record low temperature on Wednesday, as the mercury dipped to a paltry 6 degrees.
The reading broke the low mark for April 10, 7 degrees set in 1959.
After several inches of snowfall on Tuesday, the cold will stick around Wednesday in Denver. Weather forecasters predict a 10 percent chance for additional snow.
The National Weather Service forecast calls for the high temperature in Denver on Wednesday to reach 28 degrees.
"The average highs for this date are near 60s," said Bob Kleyla, a meteorologist with weather service. "If we only get to 28, that's 30 degrees below normal."
Wednesday night into Thursday, the low temperature is expected to dip to 18 degrees.
A warming trend is on tap for the rest of the week, according to the weather service.
"Saturday, we should be back up to near normal," Kleyla said.
Roads in the Denver metro area are wet, with patches of ice and snowpack in some spots. Main roads have been cleared, but side streets could be tricky.
The Colorado Department of Transportation reopened an eastbound stretch of Interstate 70 to the Kansas border around 5 a.m. after closing it overnight.
Denver International Airport has all runways clear and open Wednesday, after canceling 495 flights on Tuesday. The FAA is not reporting any major delays at DIA Wednesday morning, and officials said they did not expect to need to put full deicing operations in place.
-
-
More record lows and wild weather swings
-----------------------------------------------------------------------
Lubbock temperatures hit April record low
When the senior public relations major from The Colony looked outside Wednesday morning and saw snow, the first thing she did was go back to bed.
When she woke up to go to class, however, Taryn Beadles saw the sun shining.
“I looked on the balcony and the whole ground was covered in snow,” she said. “I was like, this is unbelievable. I definitely didn’t want to go to class today, so I hopped back on the couch and snuggled up, but when I left to go to class, it was sunny.”
Charles Aldrich, a meteorologist with the National Weather Service in Lubbock, said the city hit a record low of 22 degrees, while the previous low was 26 degrees.
The low temperature, he said, was unusual for Lubbock, but the freeze was not.
Lubbock typically experiences its last freeze April 9, so the snow was one day late, Aldrich said.
“The degree of the temperature itself, how cold it was, was fairly uncommon,” he said, “especially considering it was a record. But, to get a cold front, that’s not too uncommon this time of year.”
The upper-level low brought air to the South Plains from the arctic region, including northern Canada and Alaska, which also have been experiencing below-average temperatures, Aldrich said.
The ice and snow created by the cold front made for hazardous driving conditions in Lubbock on Wednesday morning, he said.
Between 7 a.m. and 10 a.m., 113 car accidents were reported, Lubbock Police Department Sgt. Jonathan Stewart said.
While the accidents reported involved only minor injuries, he said the number was abnormally high for a typical day, and the wrecks could be attributed to the weather.
Two accidents occurred on Texas Tech’s campus on the Ninth Street bridge, Stephen Hinkle, Tech Police Department administrative captain, said.
Both accidents involved cars sliding off the road and hitting the guardrail.
LPD, he said, responded to a five-car pile up on I-27, a pile up on Loop 289, and a pile up on Marsha Sharp Freeway.
The reason for the lack of car accidents on Tech’s campus, Hinkle said is because the physical plant began salting the roads early in the morning.
Drivers, he said, need to slow down and be cautious when on the road.
Greg Howard, a freshman advertising major from Houston, said seeing the snow in April was a culture shock, and drivers in Lubbock need to be careful.
“I like the snow,” he said, “but I feel like more people should be informed on how to drive better in the snow rather than be uninformed.”
On Tuesday, the high temperature was 81 degrees, Aldrich said.
With Wednesday’s high temperature reaching the upper 40s and becoming sunny after the low of 22 degrees with snow, Howard said predicting how to dress is a challenge.
“Here, you have to wear two different outfits throughout the day,” he said, “because the first half of the day will be cold and then the second half will be warm, so you go through clothes pretty quick.”
Aldrich said he believes Lubbock did not win The Weather Channel’s Toughest Weather City title because of the fast-changing temperatures.
“I think it’d be mainly the dust storms and the amount of severe weather that Lubbock can get is what got Lubbock into the toughest weather city in the U.S.,” he said.
Whether the sun is shining or the temperature is freezing, Beadles said loving Lubbock is the key to liking its weather.
“One of my friends embraces it and said that she is happy the city won, but for me, I’m just ready to get out of here,” she said. “I think you really have to love Lubbock to love the weather in it.”
-
Comment by KM on April 10, 2013 at 2:26am
-
http://www.cbc.ca/news/canada/saskatchewan/story/2013/04/09/sk-sask...
Lots of cold weather records falling in Sask.
Posted: Apr 9, 2013 2:36 PM CST
Last Updated: Apr 9, 2013 3:06 PM CST
Cold weather records are falling in Saskatchewan like the April raindrops we should be getting.
On Monday, 13 communities hit a record low for that day. More records fell Tuesday morning, according to CBC weather consultant Wayne Miskolczi.
The coldest spot in the province yesterday was Meadow Lake, where the mercury dropped to a record-setting -23.1 C.
Other communities that set cold-weather records for April 8 include Melfort, Kindersley and Indian Head.
Regina (-17.8) and Saskatoon (-20.6) each came close, but did not set records up to midnight last night.
Adding to the spring misery, there's still a metre or more of snow on many properties around the provinces. The good news: temperatures are supposed to rise above zero later in the week.
Here's a list of Saskatchewan communities that had their coldest April 8 ever on Monday, followed by the low temperatures and, in brackets, the old record:
- Indian Head -20.8 (-17.0)
- Kindersley -18.9 (-14.5)
- Last Mountain -21.2 (-19.5)
- Leader -15.2 (-13.7)
- Lucky Lake -17.4 (-15.4)
- Meadow Lake -23.1 (-19.0)
- Melfort -19.4 (-19.0)
- Outlook -17.9 (-13.2)
- Rosetown -17.8 (-15.5)
- Swift Current -17.0 (-15.6)
- Watrous -18.2 (-15.0)
- Weyburn -17.0 (-14.8)
- Wynyard -20.9 (-17.1)
-
-
It seems they are giving up trying to explain all the weather anomalies (in this article at least) and are just reporting what they observe, which makes no sense unless you take into account the presence of Planet X aka Nibiru and the resulting wobble.
-------------------------------------------------------------------------------------
Two-Year City Snowfall Hits Record Low
Despite the mild winter, snowpack levels in Northwest Montana are the best in the state, but the seasonal outlook is still uncerta
By Dillon Tabish, 04-07-13
While most of Montana and the continental U.S. experience worsening drought conditions, this corner of the state is exhibiting a stark contrast in weather patterns.
Separate meteorological reports released recently show the mountains in Northwest Montana benefitted from winter snowfall more than anywhere else in the state this year, while the valley floor in Kalispell broke a 120-year-old record for its lack of snow.
Through April 1, snowpack levels in the mountain ranges of the Flathead and Kootenai river basins were at the 30-year median, ranking better than anywhere else in Montana, according to the latest survey data from the USDA Natural Resources Conservation Service (NRCS).
SNOTEL sensors planted at different mountain elevations, ranging between 5,000 and 7,500 feet, showed the snow accumulation in the Flathead is at 98 percent of average, according to Brian Domonkos, NRCS water supply specialist.Specifically, the North Fork Flathead River watershed is at 103 percent of average; the Middle Fork is at 107 percent and the South Fork is at 103 percent. Areas throughout the Swan Range and Kootenai basin show similar levels that are average or slightly above average.
“The Flathead’s got it pretty good right now,” Domonkos said. “Especially with respect to what’s going on in the rest of the state where the levels are 80 to 90 percent of average.”
Yet, in sharp contrast, the lower elevation in the city of Kalispell has received the lowest amount of total snowfall the last two winters since records were first kept in 1893, according to the National Weather Service (NWS).
The weather station at Glacier Park International Airport reported 48.4 inches of overall snow the previous two winters. The winters of 1940-41, which held the previous low, produced 49.2 inches.
This year’s seasonal snowfall from October through March was 17.1 inches in Kalispell, which is almost 30 inches below average. The city’s average snowfall is 45.7 inches.
“It was a pretty gentle, benign winter. There wasn’t a whole lot going on, particularly in the valleys,” said Marty Whitmore, NWS meteorologist in Missoula. “Temperatures were on the mild side at times. The mountains themselves aren’t doing too bad. But it’s not really a huge year for snow in the mountains either.”
As one example, total snowfall accumulation at Whitefish Mountain Resort this season was tied for the second lowest since measurements were first kept in 2005. As of April 1, resort officials reported Big Mountain received 256 inches of snow this season, the same amount as in 2005. In 2010, the resort reported 170 inches. Last winter produced 301 inches on Big Mountain.
High temperatures appear to be the primary culprit.
Western Montana has not been hit with a full-blown arctic front in two years, Whitmore said. Cold fronts regularly bring blizzard conditions and long periods of cold temperatures that produce snowfall and maintain typical winter conditions.
The temperature in Missoula has not dropped below zero since Feb. 25, 2011, according to the NWS. This is the city’s second longest stretch on record, and will likely surpass the all-time mark because there has never been a subzero day in Missoula between April and October, the NWS noted.
Last month was also warmer and drier than usual in Kalispell. The average temperature in March was 36.2 degrees. The historical average is 35.4.
The temperature in Kalispell on April 1 reached 67 degrees, two degrees shy of the city’s record set in 1900.
Weather, like temperature and rainfall, will largely determine the sudden impact of runoff and what summer eventually looks like in terms of fire danger, according to both Domonkos and Whitmore.
Snow in the mountains typically begins melting in April at the lower elevations and consistent runoff occurs by May.
Water supply conditions will likely end up below average for most of the West’s rivers, according to the NWS. But early forecasts show spring and summer streamflow could remain normal in Western Montana. Flathead Lake is currently at 106 percent of the average streamflow, Domonkos said.
Other states are already bracing for the coming months and a possible sequel to last year’s historic fire season.
The Pacific Northwest could see below-normal temperatures but drier-than-normal conditions from now until July, according to the spring outlook report released recently by the National Oceanic and Atmospheric Administration (NOAA).
The report adds that areas in the U.S. that are plagued by drought could experience above-average temperatures and little moisture relief.
Last year marked Montana’s worst wildfire season in more than 100 years. More than 2,100 fires scorched 1.14 million acres statewide, according to the Northern Rockies Coordination Center. It was the most land consumed in a single year since the infamous Big Burn of 1910.
The U.S. as a whole endured one of the worst fire seasons on record in 2012. Wildfires burned more than 9 million acres nationwide, surpassing that mark for only the third time on record, according to the National Interagency Fire Center. Only 2006 and 2007 had more acreage burned.http://www.flatheadbeacon.com/articles/article/springs_pivotal_tran...
-
-
Tasmania in March 2013: exceptionally warm
March 2013 was the warmest recorded in Tasmania, with an unprecedented run of hot days to start, almost no cold weather, and another warm burst in the final week (before a cool final day). There was some heavy rain in the central north.
Prolonged heatwave ensures Tasmania's warmest March
A prolonged heatwave affected Tasmania and the rest of southeast Australia between 2 and 13 March, helping create the warmest March ever recorded in Tasmania. Many sites had their highest March mean temperature on record or their highest for many years. In several cases the March record was set in 2010, with 1974 and 1971 also very warm for Tasmania. Averaged across the state, the mean temperature was a March record of 15.7 °C, which is 2.2 °C above normal and 0.3 °C warmer than the previous record from 1974. The state average maximum temperature was a March record of 21.0 (2.9 °C above normal and 0.9 °C above the previous record from 1974), and minimum temperatures were the 3rd-warmest for March at 10.3 °C (1.6 °C above normal).
A near-stationary high over the Tasman Sea directed warm air across the state from the 2nd to the 13th, and coincided with exceptionally high sea surface temperatures. The heatwave was characterised by prolonged sequences of days and nights above threshold temperatures, and was accompanied by high humidity and generally light winds. Launceston reached 30 °C on 8 consecutive days from the 5th to the 12th, double the previous record for such a warm spell (28 to 31 January 2009). Lake St Clair and Sheffield both had an unprecedented 9 consecutive days reaching 25 °C, whilst Hobart Airport and Orford had 7 consecutive nights above 15 °C. With the heatwave affecting Victoria and SA as well, a Special Climate Statement was prepared.
Record warm days
The heatwave included several particularly warm days; the hottest day was the 12th with 37.4 °C at Bushy Park, and 37.3 °C at Grove. Some sites (including Launceston) had their highest March temperature on record, either on the 7th or the 12th. Although the second half of the month was not as warm as the first half, the 27th saw an approaching cold front push temperatures into the 30s at many sites. The 32.8 °C at Bushy Park that day was within a whisker of the highest late-season temperature ever recorded in Tasmania (33.0 °C at Scamander on 27 March 1990), whilst Launceston (30.0 °C), Strathgordon (28.5 °C) and Lake Leake (27.0 °C) were among sites that had their highest late-season maximum.
The warm weather at the start of the month, and a shortage of cold weather, meant almost all sites had their highest March mean daily maximum temperature on record (the main exceptions were on the east and south coasts, where 2010 was warmer). Many sites broke their previous records by a wide margin, and in several cases were more than 3 °C above the March average.
There was some cold weather: on the 16th and 17th temperatures in the low to mid-teens were common, some snow fell on the highest peaks, and Mount Wellington reached just 5.3 °C. For most sites the coolest day was the 31st in the wake of a cold front.
Record warm nights
Overnight temperatures were also persistently high through the first part of the month, peaking on the 12th or 13th when some sites (including Hobart, Bicheno and Devonport) had their warmest March night on record. With little in the way of cold nights it was not surprising that many sites had their highest March mean daily minimum temperature on record.
The coldest morning for most places was the 17th (when Mount Wellington fell to -1.7 °C and Liawenee and Mount Read also dropped below zero), or at the very start of the month: Liawenee dipped to -1.4 °C on the 1st.
-
-
Another low temperature record falls in Hawaii
A third low temperature record has fallen as cold north winds bring unseasonably cool temperatures to the islands.
Wednesday's low temperature of 59 degrees at the Lihue Airport broke a record low temperature set in 1956 of 60 degrees for this date.
It's the third low temperature record to fall in the last couple of days.
The temperature at Honolulu International Airport dropped to 61 degrees Tuesday morning, below the date's previous record of 62 degrees set in 2002.
The lowest temperature ever recorded in Honolulu is 52 degrees, marked on Jan. 20, 1969. Coincidentally, the coldest temperature ever recorded in Lihue — 50 degrees — falls on the same date.
It's also cold on Hawaii island, where thousands are gathering this week for the annual Merrie Monarch Festival celebrating hula and Hawaiian culture.
Temperatures dipped to 58 degrees at Hilo Airport Tuesday morning, lower than the previous record of 60 degrees set in 1953.
Hilo hit an all-time-low of 53 degrees on Feb. 21, 1962.
National Weather Service forecasters say things should start to change Thursday as warmer trade winds return. But the winds are still light, so expect another night of long-sleeve and sweater weather this evening as temperatures dip into the 50s and low 60s.
Trade winds could also bring a few showers to the usual windward and mauka areas
-
Comment by lonne rey on April 3, 2013 at 10:04am
-
Floodwaters in Spain
A man looks at floodwaters surrounding his home in Puente Duero, Spain on April 1, 2013. Spain suffered its wettest March since 1947, according to information released by the Spanish meteorological agency AEMET.
March, extremely wet, with more than triple rainfall
Precipitation
The month of March has been extremely wet in most of Spain, so that the average monthly rainfall nationwide reached the value of 157 mm., Which exceeds three times the normal value of the month is 46 mm. (Period: 1971-2000). Attempts have been the wettest March in Spain as a whole throughout the series started in 1947, exceeding 20 mm. as of March 1947, which had been so far the highest average precipitation.
As shown on the map attached in March accumulated rainfall exceeded 300% of the average in Spain, except for the regions of the northern peninsula, as well as the Mediterranean coast and the Balearic and Canary Islands part. Only small areas of the southeast peninsula and southern Balearic March rainfall did not reach normal values. Because of these heavy and persistent rainfall in March, there has been the fact that in many observatories scattered communities of Asturias, Castilla y Leon, Madrid, La Rioja, Castilla La Mancha and Extremadura Andalusia has been the month wettest March of the corresponding series, having surpassed himself in many seasons the previous maximum number of precipitation days in this month. As an example we can highlight data observatory Jaén, where there have been throughout the month to 247.4 mm. , Which is more than double the previous maximum value of the series (begun in 1985) corresponding to 2001 with 121.3 mm and Ciudad Real, where there have been 157.8 mm compared to the previous maximum of 104 , 7 mm in 1975, all on a series begun in 1971.
-
-
Drought killing century-old native trees
Downpours with enough grunt to cause flooding are needed to reverse dry soil conditions that are already killing off century-old native trees, a climate scientist says.
Jim Salinger says 70-100mm of rain is needed over a week to redress the driest soil conditions since records began 70 years ago in Northland, Auckland, Waikato, Bay of Plenty, Wairarapa and Westland.
Already, native trees including rimu - some over 100 years old - were starting to die out in Auckland.
Masterton's soil moisture was near Auckland's, meaning natives there were also at risk.
With no serious rain on the horizon, there was little that could be done for native trees and shrubs in the face of these conditions.
''It's going to rain over the next couple of weeks but that will be it for the next while.''
The 70-100mm of rain needed could cause flooding if it arrived over a short period but would not if it fell steadily over a week.
He has used a measure of soil dryness called potential evapotranspiration deficits (PED), which measures water going into the soil from rain, against that leaving through run-off, evaporation, and use by plants.
''Until there is an extended spell of rainfall during April in these drought effected areas it is probable farmers will continue to struggle to maintain adequate home grown feed supplies for stock. Producers will face extended difficulties in maintaining production on their land," Dr Salinger said.
Anything with a PED rating over 500 was extreme.
Between July last year and March this year, Masterton recorded 554, Palmerston North 432, Taupo 467, Auckland 560, and Tauranga 601.
Wellington Airport had a PED rating of 509, the third driest since records began there in 1960. At Kelburn, the rating was 346, which was above average and not unusual, Dr Salinger said.
-
-
Drought now covers almost 99 percent of Texas
More than 98 percent of Texas is in some level of abnormal dryness as spring arrives, conditions that could set drought records and lead to severe water restrictions in some regions of the state.
The weekly U.S. Drought Monitor report released Thursday by the National Drought Mitigation Center in Lincoln, Neb., showed increases in Texas in each of the five levels of drought. Only 1.4 percent of the state is not in drought, compared with 3.6 percent a week ago.
Nearly 11 percent of Texas is in "exceptional" drought, the most severe level, up from 9.9 percent a week ago. Three months ago, 95.4 percent of the state was in drought.
Tarrant County is mostly in the "severe" drought category except for a sliver along the Johnson County border, which is in "extreme" drought. Neighboring counties including Johnson, Hood, Somervell and Bosque are entirely in "extreme" drought.
Conditions statewide are now only slightly better than they were six months into the 2011 drought, the worst one-year dry spell in Texas' history, said state climatologist John Nielsen-Gammon. Conditions have steadily worsened because five of the past six months have had lower than average rainfall, he said.
Soil moisture is low statewide, and reservoirs and aquifers have not fully recharged since 2011, Nielsen-Gammon added.
"Depending on how much rain we get in the spring or summer, we may be facing more water restrictions in some parts of the state, maybe some that haven't been used before," he said.
The Edwards Aquifer, the primary water source for San Antonio, is one of several basins affected by the drought. The aquifer is nearing historically low levels, and Nielsen-Gammon said authorities fear they will have to place the most severe restrictions ever on residents in the city, one of the nation's 10 largest metropolitan areas.
Several lakes, rivers and streams also remain unusually dry. A Central Texas water authority recently cut off irrigation waters from rice farmers for the second year in a row after several Central Texas reservoirs failed to refill.
Some parts of the state could break drought records set over a seven-year stretch in the 1950s -- a dry spell so severe all water planning in Texas is based on those conditions.
"Officially, we're still in the same drought since 2011," Nielsen-Gammon said. "There's never been a time when even half the state has been out of drought so this is the third year of drought, and if it lasts through the summer, it will be the second worst drought on record."
Based on current forecasts, that is a real possibility.
Meteorologists, including Nielsen-Gammon, say outlooks show below normal rainfall during the spring -- generally the rainy season for chunks of the state -- and warm temperatures through the summer.
-
Comment by Howard on April 3, 2013 at 2:50am
-
Buenos Aires Inundated By Record Rainfall (Apr 2)
Argentina's capital was hit Tuesday by the heaviest rains in more than a century, causing floods that claimed at least six lives and left pockets of the city without electricity.
About 350,000 residents were affected by a storm that dumped up to 185 millimeters (7.3 inches) in 7 hours in the early hours of the morning, Buenos Aires Mayor Mauricio Macri said in a news conference.
The city is struggling to prepare for additional problems and has deployed hundreds of emergency workers due to weather forecasts calling for more rain, the mayor said.
At least six people likely died due to flooding, Alberto Crescenti, the head of the national health service, SAME, told reporters. One of the fatalities included a subway worker who was electrocuted when he entered a flooded station the capital, according to the subway workers union.
Local news stations showed cars covered up to their roofs in water, flooded homes and offices, and emergency workers crossing some of the hardest hit areas in inflatable boats.
Residents tried to clear storm drains plugged by garbage and other detritus. As night set in, some angry residents in areas still without electricity took to banging pots and pans as a form of protest.
The storm would have caused even more chaos had it not been for two back to back public holidays—Easter and Veterans Day—that have kept government offices and many businesses closed since last Thursday.
Power was cut in seven of some of the heaviest-populated neighborhoods of the city due to the risk of electrocution.
Sources
http://online.wsj.com/article/SB10001424127887323611604578398924249...
http://photos.mercurynews.com/2013/04/02/photos-flooding-in-buenos-...
© 2025 Created by 0nin2migqvl32.
Powered by
![]()
You need to be a member of Earth Changes and the Pole Shift to add comments!
Join Earth Changes and the Pole Shift