Polar Push & Bounce Back -Trends at the Extremes NEW ZT

**NEW ZETATALK**

This blog is about the Arctic,Antarctica and Extreme Northern/Southern Hemispheres.  Are New Trends happening at the Poles? Weather Patterns, Charts, Images and Unusual Anomalies may be telling us something!

According to the Zetas,  the Wobble Effect has now combined with a new Polar Push!!  

------------------------------------------------------------------

https://poleshift.ning.com/forum/topics/zetatalk-chat-for-november-...

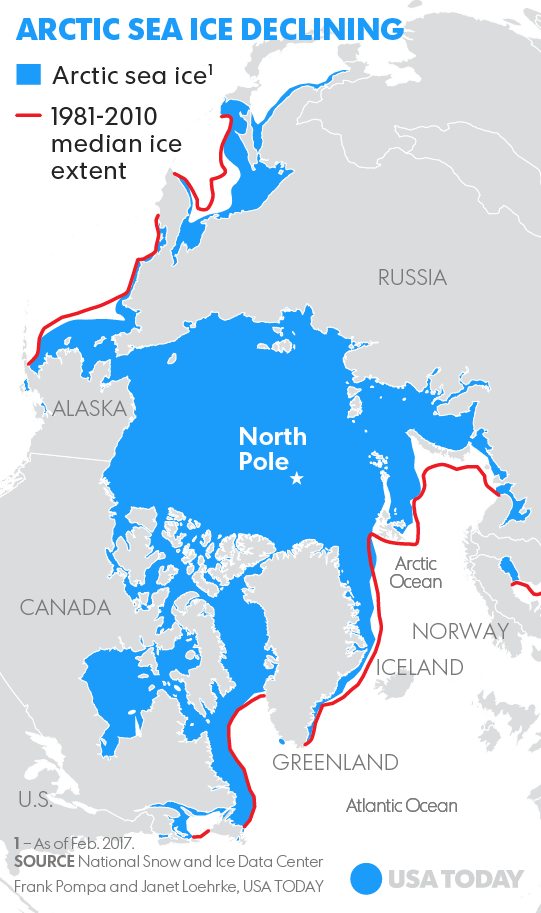
Both poles the sea ice loss is off the charts this month!  Seems something has changed?
[and from another] Is it related to the warming of the oceans from the bottom and the wobble? Where will this lead?[and from another]
https://www.wunderground.com/blog/JeffMasters/crazy-cryosphere-reco...
Sea ice extent and area have both plummeted to record lows for this time of year in both the Arctic and Antarctic. Such dramatic losses rarely occur at the same time, which means that the global total of sea ice coverage is phenomenally low for this time of year. The weirdness extends to midlatitudes: North America as well as the Arctic have been bathed in unusual mildness over the last several weeks, while Eurasia deals with a vast zone of above-average snowfall and below-average temperatures. [and from another]
https://www.theguardian.com/environment/2016/nov/22/extraordinarily...


SOZT
It is clear from the charts that the Earth wobble has increased. First, despite Siberia being on the same latitude with Eastern Canada and Europe, there are vast temperature differences. The globe around the Arctic seems to be divided in half in this way at the current time. Just months ago, in July,
http://www.zetatalk.com/ning/23jy2016.htm
we stated that the hot and cold regions in the Northern Hemisphere were divided into four parts, due to the Polar Push and Bounce Back, and the lean to the Left and Right. Now the increased wobble has created a duality, not the quadrant arrangement of the Figure 8 that had been present since 2004.  

The Polar Push wherein the N Pole of Earth is shoved away from the approaching N Pole of Nibiru continues to create cold temperatures in Siberia, where the magnetic N Pole of Earth currently resides. This has also warmed Antarctica, which is getting more sunlight.  The Bounce Back is more fierce, so that Europe and eastern N America are also getting more sunlight, and thus the melting Arctic. What is missing is the temperature anomalies due to the tilt to the Left and Right. They have been lost in the more aggressive back and forth motion of the Polar Push and Bounce Back.  
EOZT

Prior ZT: http://www.zetatalk.com/ning/23jy2016.htm
The weather maps continue to document the daily Earth wobble, showing abnormal heat over the N American southwest and up into Alaska, and abnormal heat through Europe. Both these regions come under more equatorial sun due to the wobble, due to the lean to the left and then to the right. This is distinctly balanced by cold spots in between. Canada’s eastern provinces and the region above Hudson Bay receive less sunlight due this tilt to one side and then the other. Russia’s Far East and the Siberian region above China of course are pushed into the cold by the daily Polar Push, when the N Pole of Nibiru shoves the Earth magnetic N Pole away.

----------------------------------------------------------------

The Polar Push Effect:

http://zetatalk.com/index/zeta103.htm


------------------------------------------------------------------------------------------------

Ecliptic Rise

http://www.zetatalk.com/index/earthtil.htm

Planet X approaches from the south, and the Pole Shift occurs because the S. Pole is pulled north with the N. Pole of Planet X during the passage. This stress is already evident in that many have noted that the Sun is too far south, rising too far to the south, for the time of year. Possible explanations for this are that the S. Pole has been pulled toward Planet X, creating a different tilt, but the constellations seem to be in their proper place. An alternate explanation is that the Earth's plane of the Ecliptic has changed, rising up, putting the Northern Hemisphere into a different slant, and placing the S. Pole more in line with the N. Pole of Planet X, an alignment Magnets Prefer.    

Natives to the Arctic,  the Inuit years ago already noticed many changes:

Uqalurait: the Snow is Speaking
November 23, 2009
http://www.isuma.tv/hi/en/inuit-knowledge-and-climate-change/uqalur...

An Igloolik elder, describes that uqalurait are changing because the earth itself has "tilted" and has thrown off the consistent wind patterns of the past. The earth tilting on its axis is another re-occuring observation that we are hearing from Inuit, which they know because of how the sun, moon and stars have changed in the sky. Indeed, elders simultaneously know the complexities of the cosmos, land, wind and sky.

-------------------------------------------------------------------------------------------------

Both Poles are affected!

https://www.wunderground.com/blog/JeffMasters/crazy-cryosphere-reco...

----------------------------------------------------------------------------------------------

The Zetas describe the Final Days of the Wobble:

http://www.zetatalk.com/index/zeta582.htm

During the last weeks, the Earth changes from being in an end-to-end alignment with Planet X to being in a side-by-side alignment. It is during the end-to-end alignment, when Planet X is pointing its N Pole directly at the Earth, that the lean to the left and 3 days of darkness occur. But as Planet X continues in its retrograde orbit, its N Pole is no longer coming from the right, but is located to the left of the Earth, and the Earth adjusts by slinging its N Pole to the right. Thus, during the 6 days of sunrise west, the Earth still has its N Pole tipped away from the Sun and the approaching Planet X, but rather than a lean to the left, it has a lean to the right.
 
It is at this point that the Earth switches from being in an end-to-end alignment to being in a side-by-side alignment with Planet X. When Planet X is just at the Ecliptic, it stands upright in alignment with the Sun. As it switches from pointing its N Pole at Earth the Earth follows suit.
ZetaTalk: September 12, 2009

----------------------------------------------------------------------------------------------------------------------

Some charts to follow and/or post in this blog are HERE:

Climate ReAnalyzer

http://cci-reanalyzer.org

Google has the biggest collection of charts to view/post here!

https://sites.google.com/site/arcticseaicegraphs/

-----------------------=========================------------------------------

NEW ZETATALK SEPT 30, 2017 **

http://zetatalk.com/ning/30sp2017.htm

With a stronger Polar Push the bounce back would likewise be more extreme, and the bounce back occurs when the Sun is over the Atlantic.  As the wobble continued to get worse, the Figure 8 corrective lean to the right and left also got more extreme. This sets the stage for the current 2017 hurricane season.

(Modified Earth images are from Google Earth)

Sunlight on Earth reflection based on image in the Planet X Related Captures Blog

The Figure 8 of the wobble creates a churning in the Atlantic:

1.) First land on either side of the Atlantic is pushed under water during the Polar Push,

2.) Then the N American Continent is slung to the East

3.) Then to the West as the day dawns and

4.) Then the bounce back pulls this land back up to the North. 

The wobble, in short, is churning the North Atlantic in a circular motion. Where this fits with the Coriolis effect, where the winds and water curl up from the Equator in a circular motion, moving clockwise in the Northern Hemisphere, the lean to the left does a direct clash, pushing the storm back in a path toward the US coastline.

This is the current Wobble pattern, but the Wobble is subject to change:

5.) A lean into Opposition has occurred, the N Pole leaning toward the Sun. **NEW LEAN**

6.) And a temporary Lean to the Left could occur,

7.) as well as a temporary Day of Darkness for the Northern Hemisphere.

This is not a static situation. (this will occur more than once, in other words).

Views: 18216

Comment

You need to be a member of Earth Changes and the Pole Shift to add comments!

Join Earth Changes and the Pole Shift

Comment by SongStar101 on June 1, 2017 at 9:39am

Dramatic drop in sea ice extensions for April and May for BOTH Hemispheres!

http://www.climate4you.com/SeaIce.htm

Comment by Kojima on May 23, 2017 at 1:15pm

Norway to boost climate change defences of 'doomsday' seed vault

SEED DAILY

by Staff Writers

Stockholm (AFP) May 20, 2017

Norway on Saturday said it would boost protection of a seed storage vault designed to protect the world's crops from disaster, after soaring temperatures caused water to leak into its entrance.

Situated deep inside a mountain on a remote Arctic island in a Norwegian archipelago, the Svalbard Global Seed Vault, dubbed the "doomsday" vault, is the largest of its kind and can store up to 2.5 billion seeds.

Freezing temperatures inside the vault keep the seeds, sealed in packages and stored on shelves, usable for a long period of time. Permafrost and thick rock should guarantee the seeds are frozen and secured for centuries.

But in October 2016, the warmest year on record, melting permafrost caused water to leak about 15 metres (49 feet) into the entrance of a 100-metre tunnel inside the vault.

No damage was caused to the seeds and they remain safe inside the vault at the required storage temperature of -18 degrees Celsius (-4 degrees Fahrenheit).

But the vault's managers are now constructing a waterproof wall inside for additional protection, a Norwegian government spokeswoman told AFP, adding all heat sources would also be removed from inside the vault.

"It's not good to have unnecessary heat inside" if water is coming in and permafrost is melting, Hege Njaa Aschim said.

"We have to listen to climate experts (and) we are prepared to do anything to protect the seed vault," she added.

The vault currently stores more than 880,000 seed samples from nearly every country in the world, including food staples such as maize, rice, wheat, cowpea and sorghum from Africa and Asia.

It also protects European and South American varieties of aubergine, lettuce, barley and potatoes.

"The water that leaked in had turned into ice... we had it removed," Aschim said. Norwegian authorities are "taking this very seriously" and "following it continuously," she added.

There are 1,700 gene banks around the world that safeguard collections of food crops and many of these are exposed to natural disasters and wars, according to the independent Global Crop Diversity Trust.

The Svalbard vault was opened in 2008 with the aim to provide a "fail-safe seed storage facility, built to stand the test of time and the challenge of natural or man-made disasters," the organisation says on its website.

"It is the final back up," it adds.

Each country that deposits the seeds into the vault have control and access to their own material.

Comment by SongStar101 on May 15, 2017 at 12:12pm

Satellites capture rapid movement of Arctic glacier (IMAGES)

https://www.rt.com/viral/388207-arctic-negribreen-glacier-speed/

Environment monitoring satellites have captured the rapid increase in speed of an Arctic glacier as it starts moving 13 times faster than before.

The Negribreen glacier on Norway’s Spitsbergen island has seen a dramatic increase in ice surface speed over the past year with the pace jumping from one meter a day to a staggering 13 meters every 24 hours.

This stunning surge in speed has been captured by the European Space Agency’s (ESA) Sentinel-1 satellites which are providing round the clock radar imaging of land and ocean for the space agency’s Copernicus program.

“When a glacier ‘surges’ a large amount of ice flows to the end in an unusually short time,” the ESA explain.

The reasons behind these surges are not fully understood, but they are believed to be caused by increases in the amount of heat or water in the lowest layers of the glaciers.

A team of scientists from the ESA’s Climate Change Initiative are using satellite radar and optical coverage to map glaciers at different times and determine how they are changing.

Satellites allow them much greater ability to monitor the giant sheets of glaciers as they can see through clouds and other inclement weather.

“Sentinel-1 provides us with a near-realtime overview of glacier flow across the Arctic, remarkably augmenting our capacity to capture the evolution of glacier surges,” Tazio Strozzi, who is working on the project, said.

Negribreen began picking up pace in July last year and it has been movung faster ever since, even over the winter months.

The glacier last experienced a surge of this magnitude in the 1930s when it advanced almost 12 kilometers in one year. It has been steadily retreating over the past 80 years.

Comment by Kojima on May 12, 2017 at 2:48am

Rare 'dragon-skin' ice spotted in Antarctica and researchers are rushing to study the phenomenon

BYJEFF PARSONS 18:11, 9 MAY 2017; UPDATED18:14, 9 MAY 2017

http://www.mirror.co.uk/science/rare-dragon-skin-ice-spotted-10387057

You'd be forgiven for never having heard of dragon ice.

It's a rare phenomenon that occurs when intense wind buffets water around even as it freezes. The result is a dramatic natural formation that researchers still don't fully understand.

Recent sightings of dragon ice in Antarctica are the first in ten years and scientists are hoping to get a window of opportunity to study them.

"Dragon-skin ice is very rare, bizarre, evidence of a darker chaos in the cryospheric realm, not seen in Antarctica since 2007," said Dr Guy Williams, a member of the Institute for Marine and Antarctic Studies at the University of Tasmania and one of the researchers who spotted the ice.

(Photo: IMAS)

The cryospheric realm is the area of our planet covered by surface ice - most notably the polar regions.

Dragon-skin ice is created by strong winds called katabatic winds. These winds are powerful enough to pick up the surface ice as it is freezing to expose the water underneath. That also freezes which creates the layered, scale-like pattern.

"Imagine your standard ice cube tray, filled once. After a week, you get one tray of ice cubes. But if you empty and re-fill the tray each night, you get so much more," said Williams.

(Photo: IMAS)

"That is what the katabatic winds are doing in the polynya, removing the ice, exposing the water, and making more ice form."

The dragon-skin ice was spotted by Williams and others whilst aboard the Nathaniel B. Palmer ice-breaker research vessel crossing the Ross Sea.

We will spend the next two weeks in the belly of this ice-breathing dragon, taking advantage of quiet periods when the katabatics drop off to observe the increase in salinity of the shelf waters below," said Williams.

The Nathaniel B. Palmer is set to finish its expedition in June.

Comment by Kojima on May 6, 2017 at 2:38pm

Antarctic ice rift spreads – new branch revealed in latest data from ice shelf

http://www.swansea.ac.uk/media-centre/latest-research/antarcticicer...

The rift in the Larsen C ice shelf in Antarctica now has a second branch, which is moving in the direction of the ice front, Swansea University researchers revealed after studying the latest satellite data.

The main rift in Larsen C, which is likely to lead to one of the largest icebergs ever recorded, is currently 180 km long.  The new branch of the rift is 15 km long.  

Last year, researchers from the UK's Project Midas, led by Swansea University, reported that the rift was growing fast.  Now, just 20km of ice is keeping the 5,000 sq km piece from floating away.

Picture:  the current location of the rift on Larsen C, as of May 1 2017.  Labels highlight significant jumps. Tip positions are derived from Landsat (USGS) and Sentinel-1 InSAR (ESA) data. Background image blends BEDMAP2 Elevation (BAS) with MODIS MOA2009 Image mosaic (NSIDC). Other data from SCAR ADD and OSM.

Professor Adrian Luckman of Swansea University College of Science, head of Project Midas, described the latest findings:

“While the previous rift tip has not advanced, a new branch of the rift has been initiated.  This is approximately 10km behind the previous tip, heading towards the ice-front.

This is the first significant change to the rift since February of this year.  Although the rift length has been static for several months, it has been steadily widening, at rates in excess of a metre per day.

It is currently winter in Antarctica, therefore direct visual observations are rare and low resolution. Our observations of the rift are based on synthetic aperture radar (SAR) interferometry from ESA’s Sentinel-1 satellites.  Satellite radar interferometry allows a very precise monitoring of the rift development."

Researchers say the loss of a piece a quarter of the size of Wales will leave the whole shelf vulnerable to future break-up.  Larsen C is approximately 350m thick and floats on the seas at the edge of West Antarctica, holding back the flow of glaciers that feed into it.

Picture: Larsen C ice rift – aerial view.  (Credit:  John Sonntag/NASA)

Professor Adrian Luckman said:

“When it calves, the Larsen C Ice Shelf will lose more than 10% of its area to leave the ice front at its most retreated position ever recorded; this event will fundamentally change the landscape of the Antarctic Peninsula.

We have previously shown that the new configuration will be less stable than it was prior to the rift, and that Larsen C may eventually follow the example of its neighbour Larsen B, which disintegrated in 2002 following a similar rift-induced calving event.

The MIDAS Project will continue to monitor the development of the rift and assess its ongoing impact on the ice shelf. Further updates will be available on our blog, and on our Twitter feed

Find out more about Project Midas

Study geography at Swansea University College of Science

Picture:  ice flow velocities of Larsen C in February 2017, from ESA Sentinel-1 data.

Comment by SongStar101 on April 17, 2017 at 8:59am

Huge fleet of icebergs hits North Atlantic shipping lanes

https://www.theguardian.com/environment/2017/apr/06/huge-fleet-iceb...

About 450 icebergs – up from 37 a week earlier – have drifted into waters where Titanic sank, forcing vessels to divert and raising global warming fears.

More than 400 icebergs have drifted into the North Atlantic shipping lanes over the past week in an unusually large swarm for this early in the season, forcing vessels to slow to a crawl or take detours of hundreds of kilometres.

Experts are attributing it to uncommonly strong counter-clockwise winds that are drawing the icebergs south, and perhaps also global warming, which is accelerating the process by which chunks of the Greenland ice sheet break off and float away.

As of Monday, there were about 450 icebergs near the Grand Banks of Newfoundland, up from 37 a week earlier, according to the US Coast Guard’s international ice patrol in New London, Connecticut. Those kinds of numbers are usually not seen until late May or early June. The average for this time of year is about 80.

In the waters close to where the Titanic went down in 1912, the icebergs are forcing ships to take precautions.

Instead of cutting straight across the ocean, trans-Atlantic vessels are taking detours that can add around 650km (400 miles) to the trip. That’s a day and a half of added travel time for many large cargo ships.

Close to the Newfoundland coast, cargo ships owned by Oceanex are throttling way back to three or four knots as they make their way to their home port in St John’s, which can add up to a day to the trip, said executive chairman Captain Sid Hynes.

One ship was pulled out of service for repairs after hitting a chunk of ice, he said.

“It makes everything more expensive,” Hynes said. “You’re burning more fuel, it’s taking a longer time, and it’s hard on the equipment.” He called it a “very unusual year”.

US Coast Guard Commander Gabrielle McGrath, who leads the ice patrol, said she had never seen such a drastic increase in such a short time. Adding to the danger, three icebergs were discovered outside the boundaries of the area the Coast Guard had advised mariners to avoid, she said.

McGrath is predicting a fourth consecutive “extreme ice season” with more than 600 icebergs in the shipping lanes.

Most icebergs entering the North Atlantic have “calved” off the Greenland ice sheet. Michael Mann, director of the earth system science center at Pennsylvania State University, said it was possible climate change was leading to more icebergs in the shipping lanes, but wind patterns were also important.

In 2014, there were 1,546 icebergs in the shipping lanes – the sixth most severe season on record since 1900, according to the patrol. There were 1,165 icebergs in 2015 and 687 in 2016.

The international ice patrol was formed after the sinking of the Titanic to monitor iceberg danger in the North Atlantic and warn ships. It conducts reconnaissance flights that are used to produce charts.

In 104 years, no ship that has heeded the warnings has struck an iceberg, according to the ice patrol.

Comment by SongStar101 on April 16, 2017 at 8:20am

Scientists just found a strange and worrying crack in one of Greenland's biggest glaciers

https://www.adn.com/arctic/2017/04/14/scientists-just-found-a-stran...

Scientists examining satellite images of one of Greenland's largest glaciers believe they have found an unexpected new crack in its floating ice shelf that could contribute to a dramatic break in coming years.

The Petermann glacier, located in the high Arctic at 80 degrees North latitude, is one of the most important outlets by which the Greenland ice sheet extends and flows into the sea. In 2010 and 2012 (see photo), it lost extremely large pieces, each several times the size of Manhattan, from its ice shelf, which floats on top of the waters of a fjord whose depth exceeds that of the Grand Canyon.

These changes captured the world's attention – and greatly shrank this floating shelf that stabilizes the glacier by attaching to the walls of the fjord in which it lies. That's a big deal because Petermann glacier holds back about a foot of potential sea level rise from the Greenland ice sheet.

Since the drama of 2010 and 2012, another large crack has begun to open and stretch towards the center of Petermann's ice shelf – which suggests the shelf could lose another large "ice island" soon. That's bad enough, but this week Stef Lhermitte, a researcher at Delft University of Technology in the Netherlands who studies Greenland using satellites, posted images suggesting the development of a second and different sort of crack, one that could potentially link up with the first one.

This crack, oddly, appeared to have formed in the middle of the ice shelf, rather than on its side where cracks usually begin. But given its location, it could potentially connect with the pre-existing crack if it continues to grow, extending it across much of the shelf.

Lhermitte told the Post he went back and analyzed past images, which appeared to confirm that the new crack has only begun to form since last summer – in other words, it seems to be a new feature, not visible in 2014 or 2015. But he also cautioned that he's an expert in satellite observing rather than on Petermann glacier itself, and he could not entirely rule out that the crack had been there before, but had been obscured by snow somehow.

Other researchers who know the glacier seemed to take Lhermitte's suggestion quite seriously. The Post reached out to four additional researchers or research groups to evaluate the images that Lhermitte posted. While they had a range of reactions, all agreed that the images did appear to show an apparent crack. And a common theme was that it appeared to be unusual and could possibly help precipitate a larger break.

Eric Rignot, a NASA and University of California-Irvine scientist who has studied Petermann up close, commented:

"The ice shelf is slowly but surely falling apart. It has been stable from 1901 till the 2000s, then started to break up, especially in 2010-2012. We have seen the glacier speed up for the first time around 2014-2015. Whether this new crack is significant or not is hard to tell as of now. It is unusual to see cracks forming from the center, they usually start from the sides. This could indicate that the ice shelf has gotten too thin in the middle."

Jason Box, a professor with the Geological Survey of Denmark and Greenland – who has also visited Petermann and studied it firsthand – was more alarmed. He said that if the glacier breaks here the resulting ice island could be 50 to 70 square miles in size.

"Amazing to see a new crack forming and in a location well upstream of the present day calving front," said Box, calling it a "prelude to further retreat."


-----------------------------------------------------------------

NASA just snapped the first photos of a mysterious crack in one of Greenland’s largest glaciers

https://www.washingtonpost.com/news/energy-environment/wp/2017/04/1...

Preliminary DMS image of the new rift in Greenland’s Petermann Glacier, directly beneath the NASA Operation IceBridge aircraft. (Gary Hoffmann/NASA).Oblique photo of a portion of the new rift, near bottom center, on Petermann Glacier’s floating ice shelf and an older curved rift from the flank of the shelf, near top center. The shaded feature near the bottom center is a medial flow line, which may exert a stagnating effect on the propagation of the new rift toward the older one. (Kelly Brunt/NASA)

----------------------------------------------------

https://www.washingtonpost.com/news/energy-environment/wp/2017/04/1...

Comment by SongStar101 on April 16, 2017 at 7:59am

Antarctic sea ice shrinks to smallest ever extent

https://www.theguardian.com/world/2017/feb/14/antarctic-sea-ice-shr...

Sea ice around Antarctica has shrunk to the smallest annual extent on record after years of resisting a trend of manmade global warming, preliminary US satellite data has shown.

Ice floating around the frozen continent usually melts to its smallest for the year towards the end of February, the southern hemisphere summer, before expanding again as the autumn chill sets in.

This year, sea ice extent contracted to 883,015 sq miles (2.28m sq km) on 13 February, according to daily data from the US National Snow and Ice Data Center (NSIDC).

That extent is a fraction smaller than a previous low of 884,173 sq miles recorded on 27 February 1997 in satellite records dating back to 1979. Mark Serreze, director of the NSIDC, said he would wait for a few days’ more measurements to confirm the record low.

“But, unless something funny happens, we’re looking at a record minimum in Antarctica,” he told Reuters. “Some people say it’s already happened. We tend to be conservative by looking at five-day running averages.”

In many recent years, the average extent of sea ice around Antarctica has tended to expand despite the overall trend of global warming, blamed on a build-up of greenhouse gases in the atmosphere, mainly from burning fossil fuels.

People sceptical of mainstream findings by climate scientists have often pointed to Antarctic sea ice as evidence against global warming. Some climate scientists have linked the paradoxical expansion to shifts in winds and ocean currents.

“We’ve always thought of the Antarctic as the sleeping elephant starting to stir,” Serreze said. “Well, maybe it’s starting to stir now.”

World average temperatures climbed to a record high in 2016 for the third year in a row. Climate scientists say warming is causing more extreme days of heat, downpours and is nudging up global sea levels.

At the other end of the planet, ice covering the Arctic Ocean has been at repeated lows in recent years.

In the northern winter, sea ice expands and is at its smallest extent for mid-February, at 5.38m sq miles.

Comment by SongStar101 on April 16, 2017 at 7:44am

Arctic Sea Ice Death Spiral Continues, New Record Low Extent & Thickness For March

The Arctic sea ice death spiral is continuing to accelerate, with March 2017 setting new record lows (for the month) with regard to extent and thickness. That’s based on new data released by the National Snow and Ice Data Center.

The new records continue a half-year or so period of record-low or near-record-low Arctic sea ice. As you can see in the graphs below, there’s a pretty good chance that 2017 will set a new record low for Arctic sea ice — and there’s an increasing likelihood, from the looks of it, that an “ice free” Arctic Ocean (during the summer months) is only a few years off.

To put those comments another way, there was an ~452,000-square-mile expanse of open ocean that would have been ice at this time of year not that long ago this March.

Climate Central provides more: “Temperatures were up to 13°F above normal along Russia’s coastal seas. Incidentally, those areas — particularly the Barents Sea and Sea of Okhotsk — were home to some of the largest sea ice anomalies. … Just as extent has set a record low in March, so too has thickness, according to data from the University of Washington’s Polar Science Center. NSIDC also reported that ice thinner than 6 feet ‘covers a much larger region and extends much farther north than it used to — well north of 80°N latitude on the Atlantic side of the Arctic.'”

Sea ice thickness is perhaps more interesting from the long-term perspective than sea ice extent is, as with decreasing thickness, the sea ice is much more prone to melting — meaning that there’s little doubt at this point that summer Arctic sea ice will be gone within a few decades at the most, and within just a few years at the earliest. Exact predictions of the behavior of complex systems are more or less impossible to make, but general trends can often be inferred without too much difficulty.

In this case, it’s clear that the Arctic is transitioning to an ice-free state — a change that will have an enormous affect on the weather patterns of the region, in very unpredictable but dangerous ways.

----------------------------------------------------------------------

Records are pushed farther again more than ever before:

Arctic Sea Ice Volume Anomaly

http://psc.apl.washington.edu/research/projects/arctic-sea-ice-volu...

Arctic sea ice volume through March 2017 continued substantially below prior years.  March 2017 sea ice  volume was 19,600 km3 ,  1800 km3 below the previous record from  March in 2011.   This record is in part the result of anomalously high temperatures throughout the Arctic for November through January discussed here and here.  February volume was 39% below the maximum March ice volume in 1979,  27% below the 1979-2016 mean, and more than 1.7 standard deviations below the long term trend line.

Average ice thickness in March 2017 over the PIOMAS  domain is also the lowest on record (Fig 4.)

Note that the interpretation of average ice thickness needs to take into account that only areas with ice thickness greater than 15 cm are included so that years with less total volume can have a greater ice thickness.

Above Fig 6. Shows a map of the ice thickness anomaly for March  2017 relative to the 2000-2015 base period. Sea ice is thinner almost everywhere except for a persistent thick area reaching from the North Pole to Fram Strait. March 2017 also shows small positive thickness anomalies in the Eastern Beaufort and in Davis Strait. A strong negative thickness anomaly is present along the Siberian coast of the Chukchi Sea.  Some of the sea ice thickness anomalies seem to be associated with ice motion anomalies showing a counter clockwise pattern centered on the North Pole (Fig 7) below.

An animation showing the 1979 -2016 September ice thickness evolution can be found here.

Updates will be generated at approximately one-month intervals.

--------------------------------------------------------------------------------------------

Comment by Stanislav on March 23, 2017 at 9:55pm

The Arctic, Antarctic poles just set a terrifying new record for low levels of sea ice

22 March, 2017. The amount of sea ice in both the Arctic and Antarctic is at a record low and climate change is partly to blame, scientists announced Wednesday.

Overall, the combined Arctic and Antarctic sea ice numbers are at their lowest point since satellites began to continuously measure sea ice in 1979. Arctic sea ice reached a record wintertime low for the third straight year, while sea ice around Antarctica shrank to its lowest summertime area on record. Scientists blame the decline in ice on a combination of natural, random weather and man-made global warming from the burning of coal, oil and gas.

Sea ice is frozen ocean water that has an annual cycle of melting during the summer and refreezing in winter. It floats on top of the ocean. The data comes from scientists at NASA and the National Snow and Ice Data Center (NSIDC) in Boulder, Colo. “Nature is sending us yet another distress call — the time to address human-caused climate change is now," said Lou Leonard of the World Wildlife Fund. "The Arctic is dramatically changing and worldwide, people, communities and wildlife are at risk from its cascading effects."

Sea ice in the Arctic affects wildlife such as polar bears, seals and walruses. It also helps regulate the planet’s temperature by influencing the circulation of the atmosphere and ocean. It can affect weather in the U.S.

The area of Arctic ice this month was at 5.57 million square miles — 471,000 square miles less than average.

The Arctic has been freakishly warm over the past two years. “I have been looking at Arctic weather patterns for 35 years and have never seen anything close to what we’ve experienced these past two winters,” said NSIDC director Mark Serreze. The ongoing decline of sea ice in the Arctic "is a clear indicator of climate change,” said Walt Meier, a NASA scientist and an affiliate scientist at NSIDC. In Antarctica sea ice around the continent shrank to 815,000 square miles on March 3, the lowest on record, scientists said. The previous record low ice area in Antarctica occurred in 1997.

The causes of annual fluctuations in Antarctic sea ice are not as well understood as in the Arctic, scientists said, and can vary wildly from year to year. Source: usatoday.com

SEARCH PS Ning or Zetatalk

 
Search:

This free script provided by
JavaScript Kit

Donate

Donate to support Pole Shift ning costs. Thank you!

© 2024   Created by 0nin2migqvl32.   Powered by

Badges  |  Report an Issue  |  Terms of Service