Earth Changes and the Pole Shift
Mega Disaster Costs Mounting - Proof of the Wobble
Want more Proof of the Earth Wobble? Check out high costs of recent Mega Disasters! In the Billions or possibly Trillions!
What Financial Institutions can pay for disasters on this scale? Your local or national government? The private sector such as insurance companies or private industry? Both? You?
While billions of $dollars are made available for ‘disaster relief funds’, the common man is struggling financially in the lowering Economy. Yet the price tags of Mega Disasters keeps going up! This reveals that money IS SOMEWHERE, however it has been re-allocated to pay for these and more predicted future disasters!
How much cash would help the common man? Just ONE of those billions could help the common man in their communities to prepare for the coming Pole Shift! How about re-allocating funds to the common man AFTER the Announcement to prepare for the coming Pole Shift?
Don't expect any miracles! Relief Funds are designed in concept to preserve the 'Status Quo'. They only reach communities and the common man AFTER the fact, not before. Hints of this are in the articles below.
Can funds for disasters dry up? Yes! Eventually costly disasters will drain funds out as mega disasters have been increasing since before 2003! http://www.zetatalk.com/theword/tword09o.htm
On May 19, 1999, the Associated Press reported that disasters cost the United States more than $500 billion in the past 20 years, and rising, a record cost.
Has the world's economy been affected in any way yet? Yes!
2013 now carries already a $100 billion dollar price tag! Self sufficiency and the barter system may be a good idea soon.
----------------------------------------------------------------------------
Cost of natural disasters ‘out of control’ as US clean-up bill hits $100 bn
http://tcktcktck.org/2013/05/cost-of-natural-disasters-out-of-control-as-us-clean-up-bill-hits-100-bn/52396
May 24, 2013 As figures from the Natural Resources Defense Council (NDRC) estimate the US government paid out nearly $100 billion in the aftermath of drought, floods and fires last year, the UN Secretary General has warned that economic losses caused by natural disasters are “out of control”.
Speaking in New York at the launch of a new UN report on the business case for disaster risk reduction, Ban Ki-Moon warned that the economic losses from disasters are being underestimated by around 50%.
Our startling finding is that direct losses from floods, earthquakes and drought have been underestimated by at least 50%. So far this century, direct losses from disasters are in the range of $2.5 trillion. This is unacceptable when we have the knowledge to reduce the losses and benefit from the gains.
The report (pdf) – a partnership with the UN Office for Disaster Risk Reduction (UNISDR) and consultancy Pricewaterhouse Coopers (PwC) – offered a stark warning to the world’s business community that these costs will continue to escalate in coming years. It warned companies must start mitigating for the potential impacts that they face.
The globalisation of the world’s economy over the past 40 years has led to a rapid increase in disaster risk in all countries – both rich and poor – argued the report.
For example, the 2011 Thailand floods affected a number of electronic component manufacturers with Sony and Toyota forced to close regional factories. Intel had to cut $1 billion from its quarterly profit projections in the wake of the floods.
And while governments bear responsibility for measures to mitigate disasters, Ban warned that the private sector also has a critical role to play. It accounts for 70-85% of worldwide investment in new buildings, industry and critical infrastructure.
Economic losses from disasters are out of control and can only be reduced in partnership with the private sector which is responsible for 70% to 85% of all investment worldwide in new buildings, industry and small to medium sized enterprises. The principles of disaster risk reduction must be taught at business schools and become part of the investor’s mind-set.
A US case study
The warning from the UN has been further amplified by new estimates from the NDRC showing the US government paid out $96 billion in the aftermath of drought, floods and fires last year.
This was the country’s biggest non-defense related spending and works out at around $1,100 per taxpayer. The US government spent more in 2012 cleaning up after natural disasters than they did on education or health, they said.
Superstorm Sandy, drought-induced crops failures, floods and forest fires all contributed to the costs.
Overall the insurance industry estimates that 2012 was the second costliest year in US history for climate-related disasters, with over $139 billion in damages. While private insurers covered about 25% of these costs ($33 billion), the federal government and its public insurance enterprises picked up the majority of the bill.
Dan Lashof, co-author of the report and director of NRDC’s Climate and Clean Air Program said:
While Congress debates the federal budget, our government is spending more responding to extreme weather made worse by climate change than we are to educate our kids or take care of our bridges and roads. In fact, this single-ticket expense now tops the list of non-defense discretionary federal spending. And taxpayers are shouldering more of the burden—they are spending three times more than private insurers to pay for recovery from climate damages.
-------------------------------------------------------------------------
1st Half 2013 Natural Disasters Cost $85 Billion
http://www.insurancejournal.com/news/international/2013/07/25/299600.htm
A mid-year natural disaster analysis from Impact Forecasting, the catastrophe model development center of excellence at Aon Benfield, puts economic losses from global natural disasters at $85 billion, higher than the $75 billion for the same period in 2012, but “around 15 percent lower than the 10-year (2003-2012) average of $100 billion.
Insured losses for the period reached $20 billion, lower than the $25 billion for the 1st half of 2012, and, the report said, “approximately 20 percent below the 10-year average of $25 billion. Roughly 50 percent of the insured losses resulting from natural disaster events were recorded in the United States.
“Around 24 percent of global economic losses during the first half of 2013 period were covered by insurance, a figure slightly below the 10-year (2003-2012) average of 28 percent, and due to multiple significant catastrophe events occurring in areas where insurance penetration or specific peril coverage remained low.”
Ranked by the size of the losses, the “five largest economic loss events in 1H 2013 were: The Central Europe floods during May/June ($22 billion); the China earthquake on April 20 ($14 billion); the Brazil drought ($8.3 billion); the U.S. severe weather outbreak from May 18-22 ($4.5 billion); and the China drought ($4.2 billion).”
Ranked in terms of insured losses, there were seven billion-dollar insured loss events in the first half of 2013: “the Central Europe floods during May/June ($5.3 billion); the U.S. severe weather outbreak of May 18-22 ($2.5 billion); the U.S. severe weather outbreak of March 18-20 ($1.25 billion); the U.S. severe weather outbreak of May 26-June 2 ($1.20 billion); the Australia floods during January ($1.04 billion); the Canada floods during June ($1.0 billion), and a U.S. winter storm in early April ($1.0 billion).”
More Spending costs are listed here: http://www.infoplease.com/ipa/A0882823.html
-------------------------------------------------------------------------
Billion Dollar U.S. Weather Disasters, 1980–2013
http://www.infoplease.com/ipa/A0882823.html
The U.S. has sustained 123 weather-related disasters during the 1980-2012 period in which overall damages and costs reached or exceeded $1 billion at the time of the event. Twelve occurred during 2011 alone—the most for any year on record, with total costs being approximately $52 billion.
Two damage figures are given for events prior to 2002: the first represents actual dollar costs and is not adjusted for inflation. The second (in parentheses) is the dollar cost normalized to 2002 dollars using a GNP inflation/wealth index. The total normalized losses for the 99 events are over $725 billion.
Sources include Storm Data (NCDC publication), the National Weather Service, the Federal Emergency Management Agency, other U.S. government agencies, individual state emergency management agencies, state and regional climate centers, and insurance industry estimates.
View the entire list here: http://www.infoplease.com/ipa/A0882823.html
-------------------------------------------------------------------------
Extreme weather costs nation billions in 2012
http://beyondseasonsend.org/extreme-weather-costs-nation-billions-in-2012/
- Only 2011 brought more billion-dollar natural disasters to the U.S. than did 2012.
- 2012 was the warmest year on record for the contiguous United States, a full one degree Fahrenheit hotter than the previous record and 3.2 degrees F hotter than the 20th century average. The fourth warmest winter was followed by a record-breaking warm spring, the second-warmest summer and an unusually warm autumn.
- A year-long drought struck 22 states, enveloping more than half the continental land mass. Crops withered in the nation’s breadbasket and the effects of scant precipitation were widespread, from threatening barge traffic on the Mississippi River to an unusual December wildfire in the snowless Colorado mountains. At the end of the year more than 62 percent of the continental U.S. remained in the pernicious grip of drought, causing scientists to predict widespread drought conditions would persist into the first quarter of the new year.
- Summer wildfires burned more than 9.2 million acres, more than twice as much as the average 40 years ago. The third smallest snow pack on record led to an early and long season of dry conditions.
- Two hurricanes making landfall in the U.S. made the billion-dollar disaster list: slow-moving Isaac flooded Louisiana, Mississippi, Alabama and Florida, while superstorm Sandy caused damage in 14 states up the Atlantic seaboard. Flooding in New York and New Jersey was cited by some as a harbinger of likely future disasters caused by rising sea levels.
- Between late April and early July, severe weather comprising high winds, thunderstorms, tornadoes and hail lashed eight regions in the U.S., from the Southwest, over the Rockies, across the Plains, into the Southern Plains, through the Midwest and the Ohio Valley, and into the Northeast.
In March and April, three tornado outbreaks spawning scores of tornadoes ravaged communities in the Midwest (Oklahoma, Kansas, Nebraska and Iowa); Texas; and the Ohio Valley and Southeast (Indiana, Ohio, Kentucky, Tennessee, Alabama and Georgia).
--------------------------------------------------------------------
Why were there few Scientific Warnings of Earth Change Anomalies before?
Where were the scientists years ago to warn us and industry of impending doom of Earth Changes? After all, don't big companies make money when everything is stable? $ $ $ Disasters are costly for everyone!  Is something ELSE unexpected in the mix? Companies would want to keep making profits from the valuable information and avoid negative Earth changes while they conducted their businesses. Where was the valuable information before?
The Ning has noted even more weather anomalies here! http://poleshift.ning.com/profiles/blogs/wild-weather
Is Anyone Awake?
Proof of the Earth Wobble
The Sun is now 'brighter' according to the Zetas!
http://www.zetatalk.com/index/blog0531.htm
During the entry of Planet X into our inner solar system in 2003, there was a notable increase in brightness from the Sun.
People reported being sunburned more readily, not being able to look at the Sun as it rose and set as they had been used to doing.
On Dec 11, 2005 the Zetas confirmed Sun scald since 2003, scattered white light from the Sun causing sunburn and early crops and a white Sun, all due to the disbursing of light through the tail of Planet X, which had arrived in 2003.
ZetaTalk: Sun Scald, written Dec 11, 2005
An ultra-glaring Sun was noted in 2003, when Planet X roared into the inner solar system from the direction of Orion, and screeched to a halt as it neared the Sun and the repulsion force clicked in. The tail of Planet X, not affected by the repulsion force, maintained its momentum and wafted past the Sun to deliver red dust and odd atmospheric changes to the Earth. In the Summer of 2003, it was noted that people sunburned more readily, construction workers long used to working out of doors, noted an unusual tendency to burn. Crops likewise matured two weeks early that year in many places, and comments about the intense brightness of the Sun were common. What causes the Sun scald, the intense brightness that does not translate into increased heat and cannot be correlated to solar activity or sun spots? A fog bank, with a light shown on it, appears to be evenly lit, because the light is scattered and bouncing back to the observer. Is there more light, or simply scattered light?
If the Sun is no longer yellow, it is because all light rays are scattered, and the steady state of yellow is interfered with. You formerly looked at the setting Sun without distress, the yellow or orange Sun, though the Sun was still in view and its rays were coming into your eye with full force.It is the loss of your yellow Sun that is affecting your eye's ability to look at the Sun, thus the perception of increased brightness, as the Suns rays, scattered, are presenting the same mix to your eye that high noon presents. Likewise with the rays that created sunburn, which normally are not bent toward the observer at sunset or at other than high noon, but now are scattered to arrive at one's skin. The time of day is no longer a protection from sunburn. This will only get worse, as the tail continues to turn toward the Earth.
Could a brighter Sun be causing Climate Change or the so-called Warming theory? No!
This article below, mentioned on Zeta Talk just about sums up the theory...
Brighter sun adds to fears of climate change
March 26, 2006
http://www.timesonline.co.uk/article/0,,2087-2104022,00.html
The amount of sunshine reaching earth is increasing, accelerating the pace of climate change, scientists have found. Researchers will present their findings to the European Geophysical Union conference in Vienna next week. They reverse a 30-year trend. Measurements of sunshine levels between 1960 and 1990 had shown a decrease in the amount of sunshine reaching the earth, a phenomenon known as global dimming. This was thought to have been caused by dust, smog and other pollutants, mainly from industrialized western countries. The pollutants, known as aerosols, reduced sunshine levels by absorbing and scattering solar radiation and promoting the formation of clouds that reflected radiation back into space. Sunshine levels had been decreasing by 2% a decade between 1960 and 1980 - a total decline of about 6%. Now they are going up again. Perhaps this is why our Swiss glaciers are melting. The Swiss Federal Institute of Technology in Zurich, has collated measurements from 400 sites worldwide and found an increase in sunshine at 300 of them, sited mainly in Eurasia and the Polar regions. Some showed a decline in sunshine since 1990, largely in fast-developing countries such as China and India.
------------------------------------------
Questions Mount: Brighter Sun? Is this causing Climate Change? How?
If a brighter Sun is the cause of Atmospheric Climate Changes, then why are Earthquakes happening SIMULTANEOUSLY to these Atmospheric Climate Changes? Why did an uptick start in 2003, the same year the Zetas said PX arrived in our Solar System? http://www.zetatalk.com/index/blog1114.htm
Is something ‘anonymous’ in the mix, which is not yet defined in the Global Warming Theory concerning Earthquakes?
Can the Sun's Rays Warm Earth's Crust, causing Quakes? No. Physically impossible!
Can Earthquakes be caused by the Sun ‘warming’ the atmosphere first, then the atmosphere warming the crust at the same time? No.
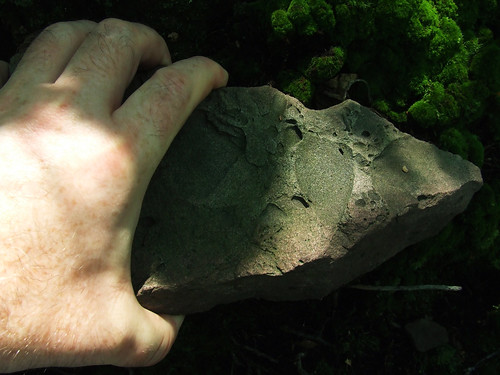
Any geologist can tell you that warmth from Sunlight or air does not penetrate rock, nor can it warm soil much more than a foot during the brightest day. Cloudy days even less. To test this statement, lift up a rock sitting in bright sunlight at noon, and feel the ground soil underneath it. It will be cool to the touch!!
Even a thin fabric umbrella shields Hot Sun by creating cool shade below!

Wine cellars or caves keep wine at constant cool temperatures! Caverns are Very Cool Places!
Here is some more information about cavern temperatures. Caverns temperatures vary only slightly:
http://www.nps.gov/wica/naturescience/cave-meteorology.htm
Significant amounts of heat can enter a cave in four possible ways. Heat may enter from the overlying rock, from the underlying rock, from air flowing into the cave, or from water flowing into the cave. We will look at each of these four possibilities, and discuss how each affects the weather in Wind Cave.
First, let's look at how heat enters the cave from the rock above it. The flow of heat through the sandstone and limestone overlying Wind Cave's passages is extremely slow. Temperature fluctuations of over 60°F between day and night are not uncommon on the surface, but if we were to monitor the temperature only two feet below the surface on such a day, the fluctuation in temperature would be only about 1°F. Therefore, it does not stay warm long enough during the day, nor does it stay cool long enough during the night, to significantly change the temperature of the rock only two feet underground. The same principle holds true for seasonal temperature fluctuations as well, although the depth at which temperatures begin to stabilize is greater. Seasonal temperature fluctuations of 80°F are reduced to only l°F at a depth of about 50 feet. So if a cave's only source of heat was from the overlying rock, its temperature would approximate the mean annual surface temperature for its area. It appears this is rarely the case. At Wind Cave for instance, the mean annual surface temperature is 47°F, yet the temperature in most parts of the cave (away from the tour routes) is 55°F. Where is all this extra heat coming from? The answer appears to be from below!
Further technical details are available here: http://www.nps.gov/wica/naturescience/nss-bulletin.htm
You can even use your cool basement for Free Air Conditioning!
 If you live in an old house and have a basement and a second floor window then you’re in luck. Whether or not your have air conditioning you can follow these five steps and stay cool without raising your energy bill.
- Close all of the windows and doors in the house,
- Open one window on the uppermost conditioned space in your house,
- Place a small window fan fitted to the window (optional),
- Open one window in the farthest corner of the basement or the north side of the lowest floor,
- Sit back and feel the cool breeze stream through your house.
More on how to do this here!
http://www.oldhouseweb.com/blog/how-to-cool-your-house-without-air-conditioning/
The Earth’s ‘Crustal Warming’ Theory Does NOT make sense
One foot (few centimeters) of dirt temperature change cannot cause deep Volcanic activity! Lava comes from miles underground not a few feet! Lava is away from sunlight and air altogether! Only an Earth Wobble would explain deep volcanic activity! Earth Wobble proof again!
Would Friction be the Hidden Factor of Crustal Warming?
If there is any warming of the ground at all, the only possibility of warming is from far below the surface, heating UPWARDS. What happens when two pieces of wood are rubbed together? Heat or fire is created.
Pic source http://www.schoolofhowto.com/8-ways-start-fire-matches/
Wiki shows several kinds of friction possible: http://en.wikipedia.org/wiki/Friction
Friction is the force resisting the relative motion of solid surfaces, fluid layers, and material elements sliding against each other. There are several types of friction:
- Dry friction resists relative lateral motion of two solid surfaces in contact. Dry friction is subdivided into static friction ("stiction") between non-moving surfaces, and kinetic friction between moving surfaces.
- Fluid friction describes the friction between layers within a viscous fluid that are moving relative to each other.[1][2]
- Lubricated friction is a case of fluid friction where a fluid separates two solid surfaces.[3][4][5]
- Skin friction is a component of drag, the force resisting the motion of a solid body through a fluid.
- Internal friction is the force resisting motion between the elements making up a solid material while it undergoes deformation.[2]

When Earth plates rub together from Wobble perturbations caused by Planet X, volcanoes erupt from the depths, not from the Atmospheric Conditions! Lava builds up deep below the crust, spews out in eruptions above the Earth crust.
Have volcanoes been increasing intensity over recent years? Yes. Again Proof of the Earth Wobble!
Notice the recent uptick after 2007 in the graph below, as the Earth Wobble became stronger according to the Zetas!
http://www.zetatalk.com/newsletr/issue051.htm
In November 2007, the wobble increased, just as the Zetas had predicted in 2004 and just as the Zetas had been warning during the summer of 2007. Where in 2005 the data collected indicated the tilt during the figure 8 wobble ranged between 4-21°, the 2007 wobble data indicated this had increased to range between 19-38°. Almost double.
Testing 'Crustal Warming' Theory Further
Could FRICTION of Earth Plate Tectonic Movement originating deep within the Earth be the cause of atmospheric warming? Yes, but only if lava flowed nearer to the surface of Earth's crust. Then the ground surface may warm slightly within only a few yards away, melting ice and such. However could combined boiling lava in various volcano calderas warm air for the ENTIRE GLOBAL ATMOSPHERE? No!
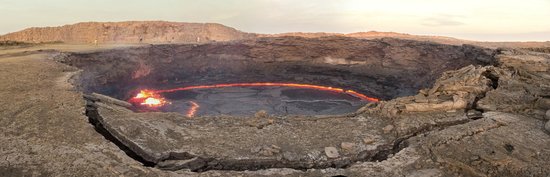 The theory of Lava pits in mere localized regions (volcano calderas) heating the ENTIRE Earth's atmosphere is like claiming lots of wood fireplaces during winter can heat the air of an entire town! Nope.

Could smoke and ash from volcanoes warm the ENTIRE Global Atmosphere? Likely not. If anything, it would COOL the atmosphere as the ash creates new CLOUD COVER!

Could mounting Mega Disasters be Human induced, such as with the Dust Bowl?
The Dust Bowl in the 1930’s was claimed to be caused by farmers tilling the grasslands away, resulting in dust powder everywhere. This was likely because the actual problem was indeed the techniques of farming, which have since improved in the region.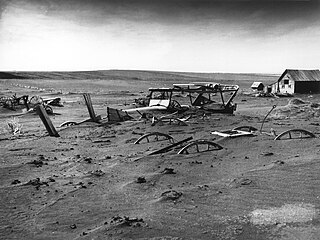
However, the Mega Disasters we see today are far greater in scope and intensity! They are not just grasslands, they are Atmospheric, Geological, Earthquakes, Sinkholes and combined with bursting Volcanoes, all simultaneously! Nothing man induced could cause such Mega Disasters with simultaneous Earth Geological changes combined! The Earth Wobble is proven!
Earth Wobble in Summary
The addition of an Earth Wobble becomes more significant when compared side by side to any other explanation or theory for current Earth simultaneous anomalies.
Thanks for reading!
Sonstar101
SongStar101
Can a brighter Sun warm the Earth crust below the Oceans? No! Impossible.
Sunlight warms ONLY a few feet down of the upper surface water layer! Deeper water temperatures are constant and cool too! http://en.wikipedia.org/wiki/Deep_ocean_water
Deep Ocean Water (DOW) is the name for cold, salty water found deep below the surface of Earth's oceans. Ocean water differs in temperature and salinity, with warm, relatively non-salty water found at the surface, and very cold salty water found deeper below the surface layer. Deep ocean water makes up about 90% of the volume of the oceans. Deep ocean water has a very low temperature, typically from 0 °C (32 °F) to 3 °C (37 °F), and a salinity of about 3.5% (35 psu).[1]
Try swimming in a lake on a hot sunny day. The top layer will seem warm, but then notice just a few feet down the water cools below, almost too cold to swim for long! Visibility gets dimmer and sunlight changes reflections on the lakebed. Sunlight is not a warming factor on the lakebed as can be seen in the image. Nor could temperatures in the atmosphere air above make any difference to the lake bottom temperatures!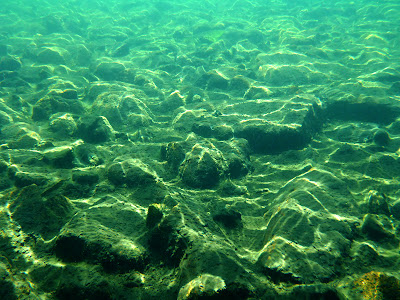
For the Sun to cause increased Volcanic and Ocean Rift activity from warming of the Ocean Water...
If there is any oceanic warming at all around the globe (contributing to more weather anomalies), the warming is coming from the BOTTOM UP. Again indisputable Proof of the Earth Wobble!
Aug 27, 2013
SongStar101
Could Gasses and Fine Dust Particles trap warm air like sponges, increasingly warming the entire Earth's atmosphere? No. IMPOSSIBLE!
Heat rises. Look at how smoke and ash from fire rises upward!
If there is moisture in the air (humidity), particles collect and attract to the moisture. When the moisture and particles stick together, the warm moisture speeds up the cooling process and the warmer particles freeze quicker as they rise up. Note how air conditioning humidifiers work. Moisture cools when it's hot outside!
Likewise gases in the air (CO2) are 'vapor' and do not heat downward either! It is IMPOSSIBLE. Vapor is vapor. It has no temperature. Even if it did, the heat would not go DOWNWARD, it would rise higher in the atmosphere and COOL and the gas linger in the cool zone!
Conclusion on Warming of Earth's Atmosphere being caused by dust, pollutants and gasses
If the Sun cannot penetrate rock, warms dirt only about two feet, then small particles of dust and gasses are even less a factor in warming the air of all Earth's Atmosphere! If there is Warming of the atmosphere at all, the OCEANS are likely rising in temperatures stemming from being heated from below the seafloor. That heat is causing expansion, as heat also expands too, so the lower portions of the land below the sea rise above the normal point of cold temperatures! Proof of the Wobble!
-------------------
Some Zeta Talk: http://www.zetatalk.com/poleshft/p164.htm
What is missing from this equation is swelling of land masses, land surface under the water, as odd as this concept might sound. Metal is known to expand when heated, but the concept of hot mud being larger in volume than cold mud has not been considered, as it has never been a concern of man’s. Heat is particles in motion, and they bump atoms about so that expansion is the result. All land surface will be heated due to the swirling of the core, the heat to the extent that it can escape into the land surface doing so. The result? This surface will expand, crevasses opening, flaky layers of rock separating, and buckling occurring that creates spaces in the interior of rock. Under the oceans, this equates to a higher ocean bottom, with the water needing to go someplace, and as the bottom is moving up, the sea level can only go up also. Thus, where this cannot be computed by man, being a missing dynamic in his statistics, this is the explanation for why our 675 foot rise does not compute given the known factors - water volume and increase per degree of heat rise.
Zetas tell how magma storms slosh to and fro under the land masses
http://www.zetatalk.com/ning/01ju2013.htm
A magma wobble was observed as early as December, 2003 when the Earth was stopped in her orbit, finding Planet X in her path. The magma wobbles were obvious in 2004, appearing regularly in the Pacific after quakes. At that time the Pacific was more affected due to the S Pole tug by Planet X which was rising from its approach below the Ecliptic. By late 2004 these magma wobbles following quakes had spread to encompass the globe. This new phenomena seemed to disappear from the live seismographs due to the USGS tuning the sensitivity of the seismographs down. Seismographs no longer turned black during quakes, and the magma wobble was imperceptible.
What has changed in 2013 that the May 24 quake in the Sea of Okhotsk created a global magma wobble? Just as this quake jolted the entire Eurasian Plate, all the way to Finland, it likewise jolted the semi-liquid magma below the plates. Liquid disburses pressure quickly, as anyone utilizing a high-pressure hose understands. It is the reason the Earth’s oceans have tides every 6 hours when the Moon only tugs on the water every 12 hours. Water adjusts quickly. What does it mean when ALL the seismograph stations show a wobble after an obvious plate movement as occurred on May 24?
Just as plate movements adjust the relationship of plates to one another, they adjust the established magma flows beneath them. If storms are evidence of air pressure in the atmosphere adjusting, these magma wobbles can be considered a type of magma storm. High pressure moving to low pressure, with perhaps new prevailing westerlies being established due to a changed sub-plate geography. Plates, as we have explained, are not smooth on the underside, but lumpy, with mountains and valleys and thus routes by which magma can flow. When this changes, radically, it takes the slurry of magma some time to establish new flow patterns. Thus, magma wobbles!
Aug 30, 2013
SongStar101
Mega Disasters in August in just the past week or so only! Massive losses, massive displacement. Volcanic activity revealed globally along with everything else.
Sep 2, 2013
SongStar101
2017 Off to Destructive Start (over $5 billion in 3mo): Severe Weather Reports Tally 5,000+, More Than Double the Average
https://weather.com/storms/tornado/news/severe-weather-hail-tornado...
The U.S. has endured a destructive start to 2017 from the multiple severe weather outbreaks since January.
There have been 5,372 preliminary reports of severe weather across the United States in 2017 through April 8, according to NOAA's Storm Prediction Center (SPC). That figure includes reports of tornadoes, large hail and wind damage.
This is more than than double the average of 2,274 for the same period of time during the past 10 years (2007-2016). In that decade, only 2008 had about the same number of severe weather reports by this point in the year with 5,242.
The animation below shows how the occurrences of wind damage, large hail and tornadoes have piled up month-by-month this year. Portions of the South have been hit the hardest, but the Midwest has also seen a high concentration of severe weather reports.
Wind damage has accounted for about 61 percent of the 5,372 severe weather reports, followed by large hail with 29 percent and tornadoes at 10 percent.
Seventy-one of 100 days have featured one or more reports of severe weather from Jan. 1-April 10, according to SPC's database. Monday marked the 26th consecutive day with at least one severe thunderstorm report logged in the U.S.
Seven states have yet to see a report of severe weather in 2017: Alaska, Connecticut, Hawaii, Maine, Rhode Island, South Dakota and Vermont.
Severe thunderstorms are largely responsible for the record number of U.S. billion-dollar weather-related disasters in the first three months of 2017. Three separate severe weather outbreaks have caused damage of a billion dollars or more, NOAA says.
(MORE: Billion-Dollar Weather Disasters of 2017)
This year has also been unusual in how far north severe weather, including tornadoes, has occurred for so early in the year.
Massachusetts was hit by two EF1 tornadoes Feb. 25, one near Conway and another near Goshen. No other February tornadoes are known to have struck the state during that month in the historical record.
Just over a week later, Minnesota experienced a similar rare early-season event when severe thunderstorms spawned three EF1 tornadoes March 6. Those were the earliest known twisters for a calendar year in the state by nearly two weeks.
(MORE: Tornado-Related Deaths in 2017)
Apr 13, 2017
SongStar101
Canadian Federal government cutting back on disaster assistance as floods become more severe
http://news.nationalpost.com/news/canada/canadian-politics/federal-...
Even as the cost of flood damage has risen in recent years, the provinces have been forced to shoulder more of the burden because the federal government has made it harder for them to qualify for compensation from its disaster relief fund.
“The (federal) government doesn’t want to be in the business of disaster assistance anymore,” says Jason Thistlethwaite, assistant professor at the University of Waterloo. “It’s too expensive.”
After a natural disaster like the current severe flooding affecting parts of Quebec and Ontario, provinces can apply to the federal government to reimburse some of their costs through the Disaster Financial Assistance Arrangements (DFAA) program. In 2015, the Conservative government tripled the amount a provincial government had to spend on disaster relief to qualify for federal compensation. A province’s total relief bill must now be greater than $3.07 per capita before it can apply to Ottawa for funding. In Quebec, for instance, that threshold is about $25 million.
The change was made because Ottawa was doling out far more DFAA money than planned, Thistlethwaite said.
During a premiers’ meeting last summer, the provinces called on the federal government to restore funding for floods and other natural disasters. The changes, they argued, “substantially reduced the federal government’s share of disaster-related costs, offloading these onto individuals, provinces and territories.”
On Wednesday, Ontario Premier Kathleen Wynne’s office said her government “remains committed” to that request.
Public Safety Minister Ralph Goodale’s office told the National Post the decision to raise the thresholds was made by the previous government.
In a statement this week, Conservative MP Steven Blaney, public safety minister when the change was made, said he was proud to have modernized the program to “ensure that emergency relief funding continues to be available to Canadians in a more sustainable way.”
Every threshold in the cost-sharing formula was raised at that time. Previously, the federal government would reimburse 90 per cent of costs above $5 per capita — about $41 million in Quebec. Now, that threshold is $15.17 per capita — roughly $124 million in Quebec.
The federal government has indeed been paying out far more than it planned for flood relief in recent years.
Last year, the parliamentary budget officer predicted the disaster assistance program would pay out more than $900 million a year over the next five years, including $673 million a year for flood damage — vastly more than the $100 million a year originally budgeted.
Thistlethwaite said the provinces are also trying to lessen their own costs, by promising assistance only for losses that can’t be insured. Since the major floods in Calgary and Toronto in 2013, many Canadian insurance companies have begun offering overland flood insurance to homeowners.
Now that that’s available, Thistlethwaite said, “everyone is going to pass this on, ultimately to the homeowner.”
That’s not necessarily a bad thing, he believes, as long as people know when they’re at risk of flooding — which many don’t.
“The part that’s missing in this entire story is that we haven’t done a good job educating homeowners.”
But even if Canadians understand the issue, they may be reluctant to open their wallets. A recent survey Thistlethwaite conducted found that while 83 per cent of respondents believe Canadians are responsible for protecting their own property from flood damage, only 23 per cent were interested in buying flood insurance.
Though Ottawa has scaled back its commitment to disaster relief, it has begun to put more emphasis on funding mitigation projects that could help prevent floods in the first place. In 2014, the Harper government launched a national disaster-mitigation program with $200 million earmarked for risk assessments, flood mapping and other projects.
But last summer, the premiers claimed that amount was “not adequate” to protect against floods, and called for more.
Thistlethwaite said that money has also been difficult to access.
“It’s a poorly designed program,” he said. “The intent is correct, but it’s completely under-resourced and it’s not utilized.”
This year’s federal budget included a new $2-billion fund for disaster mitigation and climate-change adaptation. Few details have been released about how and when that money will be spent.
The federal government has agreed to pick up the tab for the deployment of Canadian Armed Forces personnel to help with the flood response in Quebec. It is also donating $1 million to the Canadian Red Cross to help with relief efforts.
May 30, 2017
SongStar101
U.S. Forest Service wildfire tab tops record $2 billion and blazes continue to rage
https://www.japantimes.co.jp/news/2017/09/15/business/u-s-forest-se...
WASHINGTON – The Forest Service has spent more than $2 billion battling forest fires around the country — a record as wildfires blacken the American West in one of the nation’s worst fire seasons.
Wildfires have ravaged the West this summer with 64 large fires burning across 10 states as of Thursday, including 21 fires in Montana and 18 in Oregon. In all, 48,607 wildfires have burned nearly 13,000 square miles (33,586 square kilometers).
The fires have stretched firefighting resources, destroyed more than 500 homes and triggered health alerts as choking smoke drifted into major Western cities.
The Forest Service, part of the U.S. Department of Agriculture, is the nation’s primary firefighting agency.
Agriculture Secretary Sonny Perdue said the severe fire season means officials “end up having to hoard all of the money that is intended for fire prevention, because we’re afraid we’re going to need it to actually fight fires.”
The emphasis on firefighting means that money for prescribed burns, insect control and other prevention efforts is diverted to putting out fires in what Perdue called a self-defeating cycle. The end result is that small trees and vegetation remain in the forest for future fires to feed on.
“That’s wrong, and that’s no way to manage the Forest Service,” Perdue said.
The Agriculture Department has been asking Congress for years to change the way firefighting is funded so the Forest Service does not have to raid non-fire programs in bad years.
The spending figure announced Thursday marks the first time wildfire spending by the Forest Service has topped $2 billion. The previous record was $1.7 billion in 2015.
The figures do not include spending by Interior Department agencies such as the Bureau of Land Management and National Park Service, nor do they include spending by state and local governments.
The Interior Department says it has spent at least $391 million with several weeks left in the fire season. The previous record for combined federal firefighting costs was $2.1 billion in 2015.
Some previous years have had bigger areas burn but lower costs to fight fires.
“The level of continuous activity and the length of the fire season is driving our costs,” Forest Service spokeswoman Babete Anderson said.
Parts of the West have suffered through above-average fires for months, she said.
This year’s fires have renewed discussions about thinning overgrown forests to reduce the risk.
Forest fuels are at “powder keg levels,” said Paul Hessburg Sr., a Forest Service research landscape ecologist.
Interior Secretary Ryan Zinke on Tuesday directed land managers and park superintendents in his department to be more aggressive in cutting down small trees and underbrush.
Sep 17, 2017
SongStar101
The most devastating 6 weeks our planet has ever seen (video)
Dec 31, 2017
SongStar101
US shatters record for disaster costs in 2017
See source link for videos!: http://www.cnn.com/2018/01/08/us/2017-costliest-disasters/index.html
(CNN)2017 was the costliest year ever for weather and climate disasters in the United States, the National Oceanographic and Atmospheric Administration announced Monday, totaling $306 billion. The previous record year, 2005, saw $215 billion in disasters.
A hurricane season for the record books
Historic wildfire season in the West
Becoming more common
Jan 9, 2018
SongStar101
The Government Is Running Out of Money to Fight California’s Wildfires
https://www.thedailybeast.com/the-government-is-running-out-of-mone...
On Monday, the Mendocino Complex Fire became the largest wildfire in California’s history. It’s scorched more than 300,000 acres, and has grown to about ten times the size of San Francisco. The neighboring Carr Fire has burned through more than 173,000 acres, claiming seven lives.
Those are just two of the 17 fires that have thrust California into the worst wildfire season in state history. They’ve also raised a crucial question: Does the U.S. Forest Service—the agency tasked with preventing and suppressing fires on federal land—even have the money to keep fighting them?
It’s not good news. The U.S. Forest Service’s fire suppression budget has been struggling to keep pace with worsening wildfires for years, according to Jennifer Jones, a spokesperson for the agency. Jones explained via email that Congress appropriates fire suppression funds each year based on a rolling average of the prior decade, and that the agency could draw on emergency supplemental funds in times of need.
But as fires have grown larger and more destructive—and more people have built homes on fire-prone land—two problems arose. The first is that the 10-year average grew larger each year, Jones said, which meant that “the Forest Service could request less funding for other programs, including research [and] prevention.”
The second, she added, is that “in almost every year since 2000,” both the budget and the supplemental funds were no longer enough to cover the cost of fighting the fires. This forced the agency to take funds from other parts of the Forest Service’s budget.
In 2017—a “historic high” for fire suppression costs, she said—expenses hit $2.4 billion. According to Trump’s 2019 budget proposal, this required the Forest Service to take $527 million from other programs. The proposal noted that this borrowing “impedes the missions of land management agencies to reduce the risk of catastrophic fire and maintain healthy functioning ecosystems.” The fire costs were projected to increase by $500 million to $1 billion in the next five years, Jones added, which would consume as much as 67 percent of the agency’s budget by 2021.
Thankfully, that won’t happen. That’s because of the “fire funding fix” included in March’s omnibus package. The fix will provide for the appropriation of a fixed, yearly budget of $1.011 billion for fire suppression, and for the appropriation of additional funding—beginning at $2.25 billion, and rising $100 million per year through 2027—if that $1.011 billion is spent.
That fix, however, won’t go into effect until 2020. The emergency supplemental funds won’t be available in 2018 or 2019, either, although Congress appropriated an additional $500 million for 2018.
As of Wednesday, the Mendocino Complex Fire and the Carr Fire were only 47 percent contained, and still growing. It’s still possible that more wildfires could strike this year.
And these fires will only get worse in years to come. As The Daily Beast reported previously, global climate change is inextricably linked with the hot, dry weather conditions that make wildfires more common, more dangerous, and more difficult to contain.
“It’s just getting harder to fight fires,” Jeffrey Kane, an associate professor of fire ecology and fuels management at Humboldt State University, told The Daily Beast. “They cost more, they’re more dangerous, and they’re happening at a larger frequency. And that’s largely—not all, but largely—associated with climate change.” Hotter temperatures, Kane explained, will dry out fuels like leaves, trees, and branches more quickly, leaving them more susceptible to catching fire.
And while this “fire funding fix” may resolve the budget problems for suppressing existing fires, experts are concerned that Trump’s budget proposal for fiscal year 2019 will gut vital prevention and research programs that underscore suppression efforts, meaning that the government will have to keep shelling out billions for suppression in the years to come.
Despite the obvious uptick in wildfires, The Sacramento Bee reported that the Trump administration proposed slashing the section of the U.S. Forest Service’s budget dedicated to tree clearing and forest prevention by tens of millions of dollars.
This is against the protests of many experts, who claim that even at current levels, federal funding isn’t doing enough to prevent the start and spread of deadly wildfires.
“Currently we don’t do [forest management work] sufficiently enough to see a major, broad scale impact on reducing wildfires,” Kane told the Bee, which also reported the independent Little Hoover Commission’s conclusion that “California’s forests suffer from neglect and mismanagement, resulting in overcrowding that leaves them susceptible to disease, insects and wildfire.”
Part of the cuts to the Forest Service’s budget—which, under Trump’s proposal, would lose $46 million in research funds—include the elimination of the Joint Fire Science Program, a research effort between the Forestry Service and Interior Department agencies. The proposal has concerned scientists, including Kane—who called the Program “one of the best models of public funding being used to inform land management practices in a very applied way.”
He added that “It’s never been that much money, relatively speaking, and yet I think it’s had a lot of benefit.”
Kane explained that the Joint Fire Science Program funded major studies (he participated in one) designed to identify which fire prevention treatments—like cutting down limbs, also known as thinning, or strategically burning older trees before they’re hit by a wildfire, known as prescribed burning—are most effective. Reveal added that the Program has funded 280 projects conducted by 1,045 scientists in the past decade, and that those projects’ findings have been vital in on-the-ground prevention efforts. One example is New Mexico’s Ute Park Fire, where many homes avoided damage after the county implemented a fuel reduction plan based on studies the program sponsored.
Even if Congress salvages the program, Reveal notes, the financial uncertainty wrought by Trump’s budget proposal has already forced it to pause next year’s research. Funding for fire research was dwindling for years before Trump’s drastic budget proposal, going from $13 million per year before 2011 to only about $3 million per year for fiscal year 2018.
What’s more, all of these programs only impact federal land, leaving states largely to fend for themselves in terms of fire prevention and management.
California has actually been quite proactive compared to the Trump administration; Governor Jerry Brown signed an executive order that implemented a bevy of projects to improve fire management and prevention on state lands. But the federal government owns about 40 percent of California’s land; the state can only do so much—especially if Trump’s budget plan passes.
Cassandra Moseley, research professor and director at the University of Oregon’s Institute for a Sustainable Environment, isn’t particularly concerned about this. “This Congress, both sides of the aisle, have not shown themselves not particularly interested in the president’s budget,” she told The Daily Beast.
But the House and the Senate also appear reluctant to provide sufficient funding. Although they have largely rejected Trump’s massive cuts, the Bee reports that the Senate only included $5 million for removing trees, brush, and other flammable materials that fuel expanding wildfires in their budget proposal, despite the fact that the House reportedly proposed $20 million. The deadline for approval is September 30th.
There is hope. The case of the Cranston Fire, for example, suggests how infrastructural damage could be reduced if the U.S. Forest Service was funded more fully. Before the Cranston Fire stuck the small town of Idyllwild, the Bee reported, the forest service had cut down overgrown and dead trees, applied flame retardant, and conducted prescribed burns. They were approximately three-quarters of the way finished when the fire struck in late July. But because of their efforts, they managed to contain 96 percent of the fire in the weeks that followed. Only four structures were severely damaged, and no one was killed.
Currently, the Forest Service only performs that kind of treatment on 1-1.5 percent of federal land in California, the Bee notes. Until more money is allocated to preventing fires across the state, the Cranston Fire will likely be the exception, not the rule.
“If we can apply treatments to an area—through a wide range of means—then we can be effective in reducing the impacts,” Kane said. “And we just can’t do that much. I assume part of that is a funding issue, part of that is just a prioritization issue, and part of that is the overwhelming scale at which we need to do work at. It’s just too much, we don’t do enough each year, and each year goes by, and the fire deficit keeps going up.”
Aug 10, 2018
SongStar101
Brutal Hurricane Michael caused about $8B in insured losses
https://cbs12.com/news/nation-world/brutal-hurricane-michael-caused...
PANAMA CITY, Fla. (AP) — An insurance company that produces models for catastrophes is estimating Hurricane Michael caused about $8 billion in insured losses.
Boston-based Karen Clark & Company released the estimate Thursday. It includes the privately insured wind and storm surge damage to residential, commercial and industrial properties and automobiles. The figure does not include losses covered by the National Flood Insurance Program.
Michael made landfall as a 155 mph (250 kph), Category 4 storm Wednesday afternoon in Mexico Beach, Florida. The hurricane left a path of destruction through the Florida Panhandle and entered Georgia as a Category 3 storm.
KCC estimates that nearly half of insured loss from Michael occurred in Florida's Bay and Gulf counties. Total damages from storm surge are estimated to be $3.7 billion, of which about ten percent will be insured.
Oct 12, 2018