- AK - Alaska Earthquake Center
- AT - National Tsunami Warning Center
- ATLAS - ShakeMap Atlas
- CHOY - Energy Magnitude and Broadband Depth
- CI - California Integrated Seismic Network: Southern California Sei...
- DUPUTEL - Duputel et al. W phase catalog
- GCMT - Lamont-Doherty Earth Observatory Global CMT project, New Yor...
- HV - Hawaii Volcano Observatory
- ISCGEM - ISC-GEM Main Catalog
- ISCGEMSUP - ISC-GEM Supplementary Catalog
- ISMPKANSAS - USGS Induced Seismicity Project (Kansas)
- LD - Lamont-Doherty Cooperative Seismographic Network
- MB - Montana Bureau of Mines and Geology
- NC - California Integrated Seismic Network: Northern California Sei...
- NE - New England Seismic Network
- NM - New Madrid Seismic Network
- NN - Nevada Seismological Laboratory
- OFFICIAL - USGS Earthquake Magnitude Working Group
- PR - Puerto Rico Seismic Network
- PT - Pacific Tsunami Warning Center
- RDEMINERAL - Refined Determination of Epicenters (Mineral, VA)
- SE - Center for Earthquake Research and Information
- US - USGS National Earthquake Information Center, PDE
- UU - University of Utah Seismograph Stations
- UW - Pacific Northwest Seismic Network
Analysis of regional sesmic networks. Rate of Great earthquakes has increased since 2004? 54 countries have suffered from strongest or one of largest earthquake in their history
Great earthquakes on the rise?
Earthquakes M>8.6. Clustering? (Domino Effect)
Earthquakes M>7. Global sesmic moment
Catalogs of earthquakes (M>8.6)
Global sesmic moment
Great earthquakes between 1900-2013. ISC-GEM Catalog
Largest earthquakes by countries. 51 countries have suffered from their strongest or one of strongest earthquake!
Largest earthquakes data: earthquaketrack.com; USGS and in some cases articles. Period 1900-2017.
Based on USGS, earthquaketrack.com data and some local networks, articles.
Between 2000-2017:
Some (most important) records in Great earthquakes:
- 2013 Russia, Okhotsk sea largest/longest/most energy deep earthquake ever
- 2012 Indian ocean earthquake ruptures 5 fault grid- and largest strike-slip ever
- 2004 Sumatra earthquake include the longest fault rupture ever observed (720 to 780 miles or 1,200 to 1,300 kilometers) and the longest duration of faulting (at least 10 minutes). The aftershocks included the most energetic earthquake swarm ever observed
Strongest earthquake ever (24 countries):
2011 Japan, 2004 Indonesia, 2016 South Korea [104], 2016 Botswana (later downgraded) [134], 2014 Thailand [26], 2017 Papua New Guinea (later downgraded), 2009 Namibia [135], 2013 Iran, 2013 Pakistan [119], 2006 Mozambique, 2009 Honduras, 2012 Norway [8], 2002 Kosovo, 2016 Northern Mariana islands, 2004 Morroco, 2012 Ireland [133], 2009 Benin, 2008 Western Sahara, 2012 Mauritania (same magnitude as in 1993), 2000 Nigeria, 2008 Rwanda, 2002 UAE, 2017 Niger, 2001 Angola
Second-strongest earthquake ever (13 countries):
2012 Canada [98], 2008 China (same magnitude as in 1932, 1931), 2016 New Zealand (same magnitude as in 1929, 1931 and 2009), 2010 Chile, 2011 Canary islands, 2012 Costa Rica [59], 2009 Samoa, 2015 Nepal, 2009 Bhutan, 2003 Algeria, 2017 Zambia, 2009 Malawi, 2002 Tunisia
Strongest in years or since ... (17 countries):
2010 Haiti (in 200 years) [118], 2014 Sweden (in 100 years) [107], 2011 Hungary (since 1985) [117], 2009 Portugal (since 1969) [18], 2015 Malaysia (strongest since 1976) [136], 2011 US East coast (strongest since 1944) [82], 2014 Czech Republic (strongest since 1985) [2], 2016 Italy (strongest since 1980) [60], 2012 Mexico (strongest earthquake since 1985) [95], 2016 Ecuador (strongest since 1979) [71], 2014 South Africa (strongest since 1969) [137], 2015 Afghanistan (strongest since 1909), 2000 Turkmenistan (strongest since 1948), 2007 Laos (strongest since 1983), 2012 Guniea (strongest since 1983), 2014 Puerto Rico (strongest since 1943), 2013 Russia (strongest since 1952)
Summary (54 countries) (17 countries show increase in local sesmics networks see below)
Local sesmic networks:
Sesmic activity increase in Italy, US (Without California), South Korea, Japan, Cuba, Canada, Mexico, Queensland (Australia), Russia, Czech Republic, New Zealand, Thailand, Portugal, China, Nepal, Canary islands, Puerto Rico, Iceland, Greece, Italy.
Under question: Spain [110], Belgium [153], Netherlands [134]
No increase or decrease or stable: Switzerland [155], Britian [144], Brazil [145], Australia [146], Nicaragua [147], Israel [148], France [149], Colombia [150], Germany [151], Alaska [152], California [130] (US)
Since 2008 (begin of 0 of 10 scaling by Zetas) we seen increase in earthquakes (but later in 2012, 7 of 10 pace slowed). Largest earthquakes by countries. Between 1998-2016
Q&A. Why large earthquakes more important than small?
Source of image: psalm11918.org
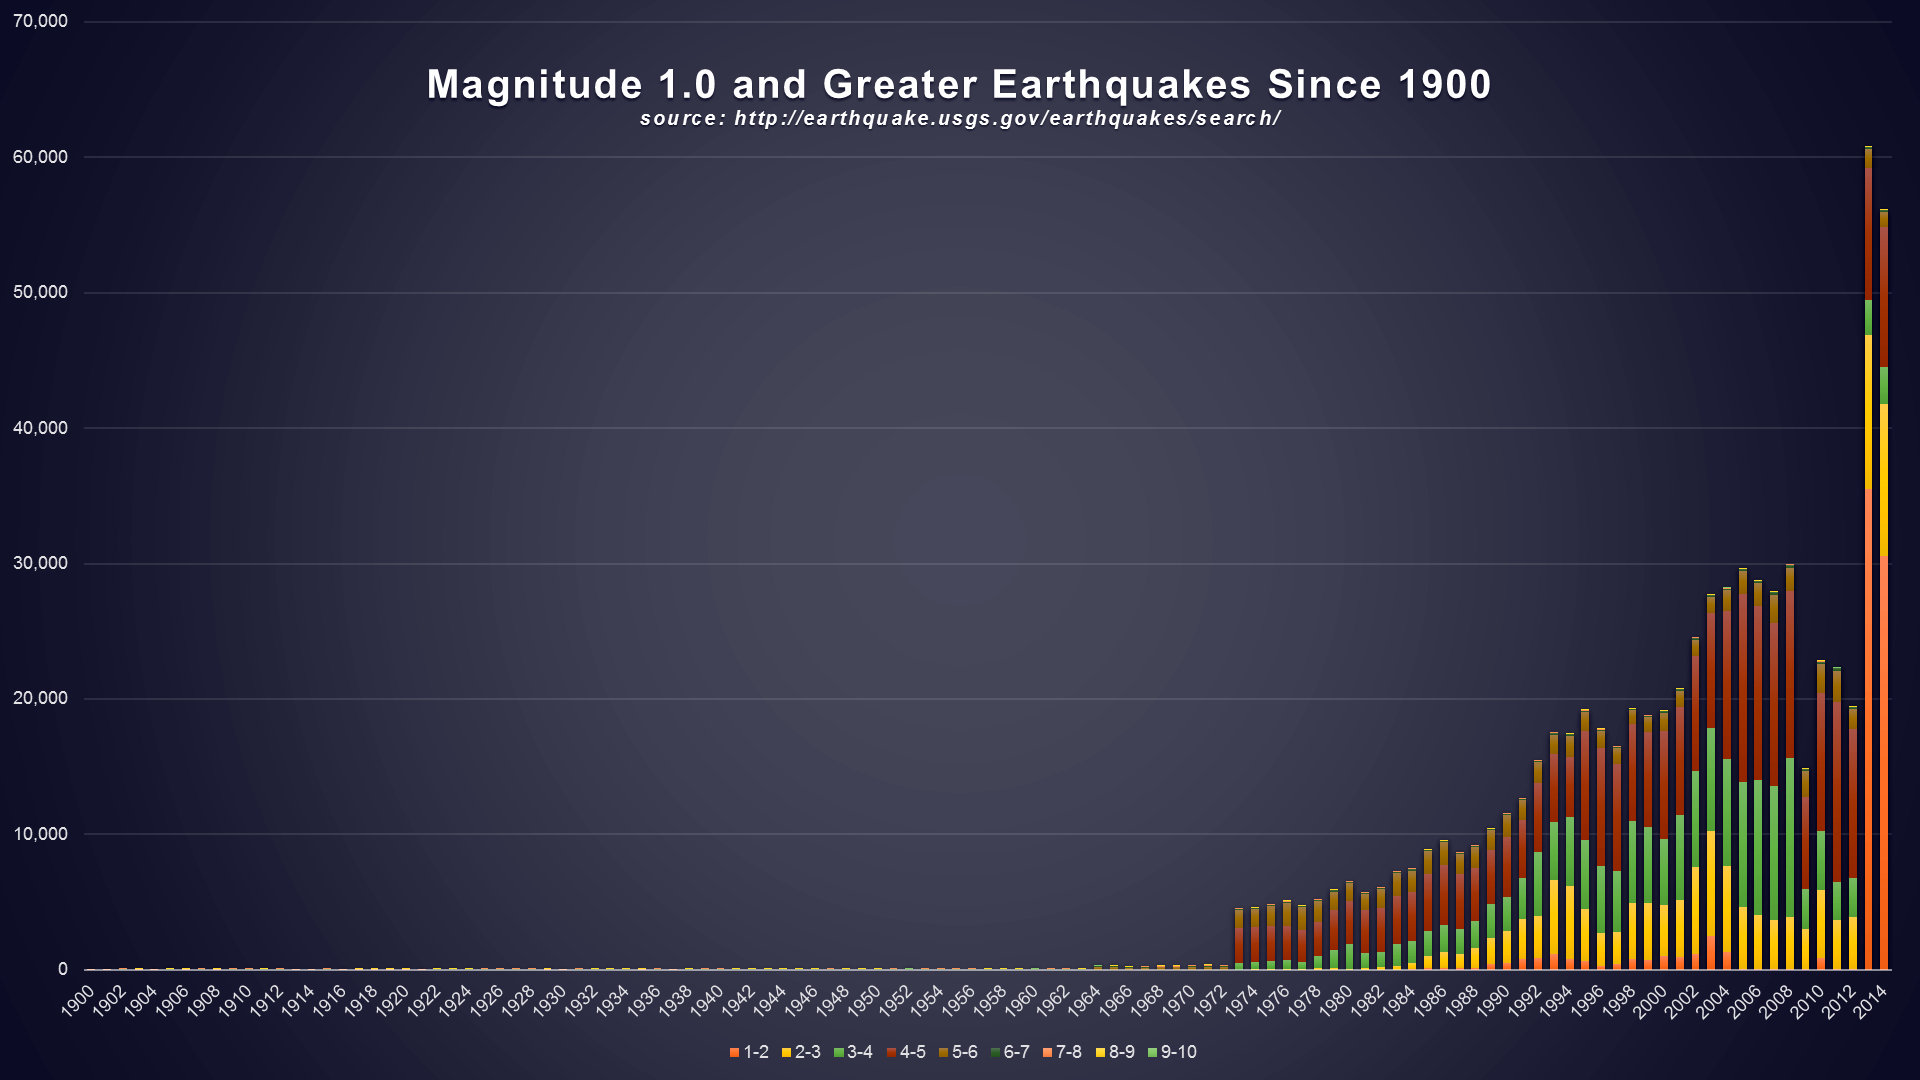
As we seen earthquakes with small magnitudes (M<1) were simply not registered in past. (before 1974). The same applies to larger earthquakes M<6. That's why the number of small earthquakes does not matter (for statistics). On top of the graphs, we see that small earthquakes are only afteshocks from large and record quakes. Thus, the number of small earthquakes does not matter, here are the explanations of the USGS:
Source: USGS FAQ - web.archive.org
Regional earthquake catalogs show earthquakes increase in last decades
Italy earthquakes m>3
All earthquakes
Earthquake data source: [63] 'ISIDe working group (2016) version 1.0, DOI: 10.13127/ISIDe'.
Since 2005, they have changed the type of magnitude. This somewhat confuses the situation. Some earthquakes are recorded in the old magnitude. But there is no doubt that seismic activity is stronger than ever (of sesmic network observations) in Italy now. Earthquakes between 1-1.9 show increase in sesmic stations!
Earthquake data source: [63] 'ISIDe working group (2016) version 1.0, DOI: 10.13127/ISIDe'.
Greece
Greece M>6 Earthquakes
All Earthquakes
Earthquake data source: [64] National Observatory of Athens
2008 year looks like a record in Greece, while 2009 - 2013 looks like due increase in sesmic stations
Second Greece catalog M>2
Earthquake data source: [65] Permanent Regional Seismological Network operated by the Aristotle University
of Thessaloniki, doi:10.7914/SN/HT
Ireland
Iceland
Iceland earthquakes M>4
All Earthquakes in Iceland
Earthquake data source: [9] Icelandic Meteorological Office
Norway biggest earthquakes
Earthquake data: NORSAR [4]
Czech Republic
Infographic references:
[1] Geofyzikalni ustav Akademie ved CR, v.v.i. (n.d.). Retrieved August 14, 2017, from http://www.ig.cas.cz/webnet-informace#zemetresne-roje;
[2] Plechat, J., Wirnitzer, J., & Vyroubalov, M. (2014, May 31). Chebsko zas. Retrieved August 14, 2017, from http://vary.idnes.cz/zemetreseni-na-chebsku-07k-/vary-zpravy.aspx?c...;
[3] Zem. (2014, June 04). Retrieved August 14, 2017, from http://www.lidovky.cz/zemetreseni-na-chebsku-bylo-nejnicivejsi-v-hi...
Earthquake data source: [3] CzechGeo / EPOS
All Earthquakes registered by Czech Republic sesmic network
Only Czech Republic M>3
Earthquake data source: [3] CzechGeo / EPOS
Portugal
All earthquakes in Portugal
Sweden
Hungary
Spain and Canary islands
All Earthquakes in Canary islands
Earthquakes data: [110] Instituto Geografico Nacional
Earthquakes increase in North America continent?
I made this map using QGIS.
All earthquakes in North America between 2009 - 2016
All earthquakes in North America between 2000 - 2008
United States earthquakes M > 3
United States without California M > 3
Earthquake data: USGS [130]
All US Earthquakes M>3. California earthquakes decrease
Mexico
Mexico earthquakes M>6
All Earthquakes
As we see earthquakes with a magnitude of 3, 4, 5, 6 and even 7 show increase. While earthquake between 0 - 2.9 show increase in sesmic stations. But even if we assume that earthquakes of magnitude 3 are fully absorbed due to the increase in seismic stations, earthquakes of a magnitude higher are difficult to explain.
Earthquakes data: [96] Servicio Sismologico Nacional | UNAM, Mexico
Canada
Canada earthquakes m>3
All Earthquakes Canada
Earthquake data source: [103] Natural Resources Canada
Korean Peninsula earthquakes
Infographics references:
[1] Strongest-ever earthquake hits Korea, tremors felt nationwide. (2016, September 12). Retrieved August 14, 2017, from http://www.koreatimes.co.kr/www/news/nation/2016/09/116_214014.html
[2] H. (2016, July 06). Korea no longer safe from earthquakes: experts. Retrieved August 14, 2017, from http://www.koreaherald.com/view.php?ud=20160706000745
[3] KMA [106]
Earthquake data source: [106] KMA
China
Earthquakes data source: [53] WDC for Seismology, Beijing
Number of opened sesmic stations in China per year
Earthquakes data source: [53] WDC for Seismology, Beijing
In 2004 and 2001 the stations were updated and since then nothing has changed. The explosion of activity in 2008 was caused by the Sichuan earthquake. But even without it, the data show growth.
Japan
Infographic references: [1, 2] 2011 Tohoku earthquake and tsunami. (2017, August 14). Retrieved August 14, 2017, from https://en.wikipedia.org/wiki/2011_T%C5%8Dhoku_earthquake_and_tsunami
Source: [116] Japan Meteorological Agency
Indonesia
Malaysia
New Zealand
All Earthquakes in New Zealand
Earthquake data source: [55] GeoNet earthquake catalogue
Since 2012 Geonet change magnitude type.
Nepal
Infographic references:
[1] Desk, E. W. (2015, April 27). Timeline: Nepal 2015 to 1934, the worst quake disasters in the last 80 years. Retrieved August 14, 2017, from http://indianexpress.com/article/world/neighbours/timeline-nepal-20...
[2] Khadka, N. S. (2015, May 08). Himalayan 'drop after Nepal quake'. Retrieved August 14, 2017, from http://www.bbc.com/news/science-environment-32625431
Earthquake data: [24] National Seismological Centre Nepal
Thailand and neabry areas
Data source: [29] Thai Meteorological Department
Australia, Queensland
Earthquake data source: [35] CQSRG Monitoring network
This non-commercial network has only two seismic stations.
Russia
Infographic references:
[1] Ghose, T. (2013, September 19). Earth's Biggest Deep Earthquake Still a Mystery. Retrieved August 14, 2017, from https://www.livescience.com/39791-biggest-deep-earthquake-a-mystery...
[2] Oskin, B. (2013, May 24). Russian Earthquake Could Be Deepest Ever. Retrieved August 14, 2017, from https://www.livescience.com/34671-russian-earthquake-deepest-ever.html
[3] Englund, W. (2013, May 24). Massive Russian earthquake felt 4,000 miles from epicenter. Retrieved August 14, 2017, from https://www.washingtonpost.com/news/worldviews/wp/2013/05/24/massiv...
All earthquakes in Russia
Deep earthquakes increase in Russia?
Data source: [40] Geophysical Survey of the Russian Academy of Sciences
Opened sesmic stations per year in Russia between 1990 - 2016
Closed sesmic stations per year in Russia between 1990 - 2016
Ukraine
Kazakhstan
Ecuador
Iran
Pakistan
Puerto Rico
Infographic reference: [1] Red Sismica de Puerto Rico [132]
Earthquakes m>6
Earthquake data source: [132] Red Sismica de Puerto Rico
Costa Rica
Haiti
Cuba
The increase in earthquakes in Cuba is caused by an unprecedented earthquake in Haiti in 2010.
Second magnitude type
Earthquake data source: Centro Nacional de Investigaciones Sismologicas (CENAIS)
Zimbabwe
Namibia
Sri Lanka
Nigeria
Botswana
Cover-up. Fracking, Wastewater-injection, Wastewater disposal in North American continent
Source of images: [1], [2], [3], [4], [5]

Source of images: extremetech.com
Links: [1], [2], [3] - (1, 2, 3)
References list
D3.js examples
All charts made use D3.js. All examples under GNU General Public License, version 3.
Code examples below:
Code
https://bl.ocks.org/mbostock/3885304
Code
https://bl.ocks.org/mbostock/1166403; https://bl.ocks.org/d3noob/59...
Code
Views: 1591
Comment
-
Comment by Stanislav on August 22, 2017 at 2:12pm
-
USGS inaccuracy, incompetence or manipulation?
One blogger noticed that the USGS data changed I decided to check it:
The clue to why a quake was reported as an alert, 92 years after the fact, lies in the explanation given to the BBC. The USGS process reported was to “revise and update information about where the historic quake struck”. Why does one need to review and update historical information? One does not change historical information, particularly one where the location had been precisely noted at the time. The USGS has inadvertently given the public an insight into how much they manipulate quake data.
ZetaTalk Chat Q&A for July 1, 2017
Magnitude M>6
References:
[1] Mara, S., & Vlad, S. (2013, March 20). Global Climatic Changes, a Possible Cause of the Recent Increasing Trend of Earthquakes Since the 90's and Subsequent Lessons Learnt. Retrieved August 21, 2017, from https://www.intechopen.com/books/earthquake-research-and-analysis-n...;
[2] http://thoughtleadership.aonbenfield.com/Documents/20140113_ab_if_a...;
[3] 2017 - https://earthquake.usgs.gov/earthquakes/search/
Magnitude M>6
References:
[1] Stephenson, B. (n.d.). Is the Tribulation Near? Retrieved August 21, 2017, from https://www.psalm11918.org/Resources/Blog/2014/09/is-the-tribulatio...;
[2] 2017 - https://earthquake.usgs.gov/earthquakes/search/
Magnitude M>7
[1] - http://exjehovahswitnessforum.yuku.com/topic/19983#.WZvw8St_pSF
[2] 2017 - https://earthquake.usgs.gov/earthquakes/search/
Earthquakes M>6 (Sources of catalog)

Earthquakes M>6 (Magnitudes types)

Data source: https://earthquake.usgs.gov/earthquakes/search/
1) The USGS data is a collection of several catalogs:
https://earthquake.usgs.gov/data/comcat/catalog/
2) The type of magnitude changed with time (See above)
3) These inconsistencies can be the result of adding new (old) data and recalculating the magnitudes. Nevertheless, it's not clear why 1990 - 2010 period almost didn't change (in M>6, M>7)
Thus, we see that it is almost impossible to draw any conclusions based on these data. ll this raises questions as far as they are at all competent?
© 2024 Created by 0nin2migqvl32.
Powered by
![]()
You need to be a member of Earth Changes and the Pole Shift to add comments!
Join Earth Changes and the Pole Shift