Wild Weather, the Wobble Effect
|
Weather: |
Tides and Whirlpools:
|
"We warned at the start of ZetaTalk, in 1995, that unpredictable weather extremes, switching about from drought to deluge, would occur and increase on a lineal basis up until the pole shift. Where this occurred steadily, it has only recently become undeniable. ZetaTalk, and only ZetaTalk, warned of these weather changes, at that early date. Our early warnings spoke to the issue of global heating from the core outward, hardly Global Warming, a surface or atmospheric issue, but caused by consternation in the core. Affected by the approach of Planet X, which was by then starting to zoom rapidly toward the inner solar system for its periodic passage, the core was churning, melting the permafrost and glaciers and riling up volcanoes. When the passage did not occur as expected in 2003 because Planet X had stalled in the inner solar system, we explained the increasing weather irregularities in the context of the global wobble that had ensued - weather wobbles where the Earth is suddenly forced under air masses, churning them. This evolved by 2005 into a looping jet stream, loops breaking away and turning like a tornado to affect the air masses underneath. Meanwhile, on Planet Earth, droughts had become more intractable and deluges positively frightening, temperature swings bringing snow in summer in the tropics and searing heat in Artic regions, with the violence of storms increasing in number and ferocity."
From the ZetaTalk Chat Q&A for February 4, 2012:
The wobble seems to have changed, as the temperature in Europe suddenly plunged after being like an early Spring, Alaska has its coldest temps ever while the US and much of Canada is having an extremely mild winter. India went from fatal cold spell to balmy again. Has the Earth changed position vs a vs Planet X to cause this? [and from another] Bitter cold records broken in Alaska - all time coldest record nearly broken, but Murphy's Law intervenes [Jan 30] http://wattsupwiththat.com/2012/01/30/bitter-cold-records-broken-in-alaska Jim River, AK closed in on the all time record coldest temperature of -80°F set in 1971, which is not only the Alaska all-time record, but the record for the entire United States. Unfortunately, it seems the battery died in the weather station just at the critical moment. While the continental USA has a mild winter and has set a number of high temperature records in the last week and pundits ponder whether they will be blaming the dreaded "global warming" for those temperatures, Alaska and Canada have been suffering through some of the coldest temperatures on record during the last week.

There has been no change in the wobble pattern, the wobble has merely become more severe. Nancy noted a Figure 8 format when the Earth wobble first became noticeable, in early 2005, after Planet X moved into the inner solar system at the end of 2003. The Figure 8 shifted along to the east a bit on the globe between 2005 and 2009, (the last time Nancy took its measure) as Planet X came closer to the Earth, encountering the magnetic N Pole with a violent push earlier in the day. But the pattern of the Figure 8 remained essentially the same. So what changed recently that the weather patterns became noticeably different in late January, 2012?
The N Pole is pushed away when it comes over the horizon, when the noon Sun is centered over the Pacific. This regularly puts Alaska under colder air, with less sunlight, and thus the historically low temps there this January, 2012 as the wobble has gotten stronger. But by the time the Sun is positioned over India, the N Pole has swung during the Figure 8 so the globe tilts, and this tilt is visible in the weather maps from Asia. The tilt has forced the globe under the hot air closer to the Equator, warming the land along a discernable tilt demarcation line.
The next loop of the Figure 8 swings the globe so that the N Pole moves in the other direction, putting the globe again at a tilt but this time in the other direction. This tilt is discernable in weather maps of Europe, again along a diagonal line. Depending upon air pressure and temperature differences, the weather on either side of this diagonal line may be suddenly warm or suddenly cold. The tilt and diagonal line lingers to affect much of the US and Canada, but the Figure 8 changes at this point to be an up and down motion, pulling the geographic N Pole south so the US is experiencing a warmer than expected winter under a stronger Sun. Then the cycle repeats, with the magnetic N Pole of Earth pushed violently away again as the Sun is positioned over the Pacific.
From the ZetaTalk Chat Q&A for April 6, 2013:
Would the Zetas be able to let us know what is causing the early break-up of the Arctic Ice, the ice seems to have taken on a swirling pattern at the same time, would this be wobble related? [and from another] http://www.vancouversun.com/news/national/Canada+Arctic+cracks+spec... The ice in Canada’s western Arctic ripped open in a massive “fracturing event” this spring that spread like a wave across 1,000 kilometres of the Beaufort Sea. Huge leads of water – some more than 500 kilometres long and as much as 70 kilometres across – opened up from Alaska to Canada’s Arctic islands as the massive ice sheet cracked as it was pushed around by strong winds and currents. It took just seven days for the fractures to progress across the entire area from west to east. [and from another] http://earthobservatory.nasa.gov/IOTD/view.php?id=80752&src=iot... A high-pressure weather system was parked over the region, producing warmer temperatures and winds that flowed in a southwesterly direction. That fueled the Beaufort Gyre, a wind-driven ocean current that flows clockwise. The gyre was the key force pulling pieces of ice west past Point Barrow, the northern nub of Alaska that protrudes into the Beaufort Sea.
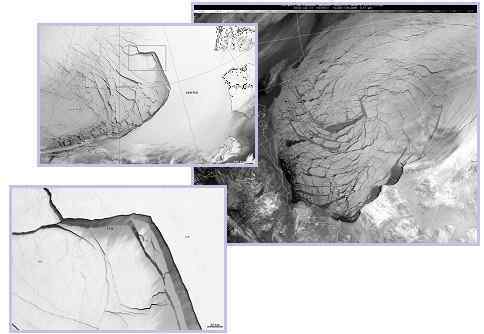
The Figure 8 formed by the N Pole during the daily Earth wobble has shifted somewhat to the East, due to Planet X positioned more to the right of the Earth during its approach. This was anticipated, and well described in ZetaTalk, the Earth crowding to the left in the cup to escape the approach of Planet X, so the angle between these two planets would change slightly. This shift of the Figure 8 to the East is due to the push against the Earth’s magnetic N Pole occurring sooner each day than prior. Thus instead of occurring when the Sun is high over the Pacific, over New Zealand, it is now occurring when the Sun is high over Alaska. All the wobble points have shifted eastward accordingly.
This has brought a lingering Winter to the western US, and a changed sloshing pattern to the Arctic waters. Instead of Pacific waters being pushed through the Bering Straits into the Arctic when the polar push occurs, the wobble is swinging the Arctic to the right, and then later to the left, creating a circular motion in the waters trapped in the Arctic. Since the Earth rotates counterclockwise, the motion also takes this path. This is yet another piece of evidence that the establishment is hard pressed to explain. They are attempting to ascribe this to high pressure and wind, all of which are not new to the Arctic, but this circular early breakup of ice in the Arctic is new.
Views: 627065
Comment
-
Comment by Sevan Makaracı on October 11, 2012 at 11:11am
-
RARE OCTOBER SNOW ACCROSS SOUTH AUSTRALIA (OCT 11)
Rare at any time, there has been October snow across some southern areas of South Australia.
The weather bureau in Adelaide said the last reports of snowfall in the Adelaide and neighbouring Mount Lofty Ranges region in October were a century ago.
Locals at Hallett in the mid-north of the state, around Crafers, Mount Lofty, Lobethal and Belair in the Adelaide hills, Sevenhill in the Clare Valley and Mount Remarkable in the lower Flinders Ranges have been surprised by snowfalls.
Farmers in the agricultural areas have welcomed rainfall that has boosted their crop prospects.
Some grain growers say the falls have come too late for them, but crops in later districts will get the benefits.
The highest measured falls in the state have included 34mm at Kuitpo in the Mount Lofty Ranges, 27 millimetres at Wilmington in the upper north and 26mm at Melrose.
There have been 21mm at Clare in the mid-north, 19mm at Riverton, 17mm at Auburn, 8mm at Lameroo in the Murray Mallee and 11mm at Keith in the south-east.
Adelaide has had about 18mm.
A maximum wind gust of 91 kilometres per hour was recorded at Edithburg on lower Yorke Peninsula.
Emergency volunteers have been called to dozens of incidents since the rough weather first hit Adelaide late on Wednesday.
Many of the problems were with fallen trees.
At suburban Brighton, a car was crushed when a large shopping centre sign fell in high winds.
Raelene Zanker, from Booleroo Centre, said she had lived in the region for half a century and not seen snow so late in the season.
"Going back I think it was in the '70s some time we had lots and lots of snow, but we haven't had anything like that for years now and we've never seen snow in October before, well not since I've been here anyway," she said.
The October freeze saw Mount Lofty's minimum temperature hit 0.4 degrees Celsius this morning. It got as low at 0.6 at Naracoorte and 1.1 at Mount Crawford.
Senior forecaster Tom Boeck confirmed the rarity of the weather conditions.
"In springtime we do get some quite significant shifts in the weather in terms of temperature, but I must admit it's quite unusual to be getting a snow event in October," he said.
-
Comment by Howard on October 8, 2012 at 3:53am
-
First Week in October Brings Record Cold and Snowfall Across U.S. (Oct 7) -
With 74 record lows set on Oct 6 - as low as minus 5 degrees F (-21 C) in Wyoming and over a foot of snow in Minnesota, the unrelenting heat and drought of this year's summer has abruptly moved into winter within the first several days of October.
-
-
Driest August & September in Vancouver BC on Record
Only eight mm of rain fell over those months this year, breaking the previous record set in 1907 of 9 mm of precipitation in August and September.
The 1907 record was set in Steveston, where weather data dates back to 1896.
Records have been kept in Vancouver since 1937.
The record for the month of August alone was set in 1986, when there was zero recorded rainfall.
There was 3 mm of rain this August.
For September, the record is 0.3 mm, set in 1975. This year, 5 mm of rain was recorded at Vancouver International Airport.
It’s expected the dry conditions will stick around — there’s still no rain in this week’s forecast.
-
-
Tropical Storm Nadine, which formed in the north-central Atlantic 3 weeks ago (on Sept 11) is breaking records as one of the longest lasting tropical storms on record as it continues to loop in circles.
Tropical Storm Nadine Still Alive, 3 Weeks Later -
http://www.heraldtribune.com/article/20121002/ARTICLE/121009926
Nadine seemed destined to be forgotten as just another tropical storm that fizzled out at sea. Now, still churning loop-de-loops in the Atlantic Ocean, Nadine is making history as one of the longest-lasting tropical storms ever.
At about the same latitude as North Carolina, Nadine has been been a named storm for 20 days. If it lasts another week, Tropical Storm Nadine would break the record for longevity.
But even if it dies out, Nadine is already going down in the record books. Only seven tropical systems have remained at tropical depression strength or greater for longer than Nadine, according to National Hurricane Center records.
The storm that beats them all was the San Ciriaco Hurricane of 1899 — a record set before aircraft and satellites provided fine details of a storm's lifespan.
While the people in the Azores — a Portuguese island chain 970 miles west of Lisbon — are tiring of Nadine's persistence nearby, forecasters are marveling. The storm was making its third pass at the island on Tuesday, prompting the Portuguese government to issue a tropical storm watch.
"You usually don't see a tropical storm stick around at 35 degrees northern latitude for very long," said Mark Paquette, a meteorologist with Accuweather.com.
Nadine formed on Set. 11 in the north-central Atlantic, the last system spawned so far this year.
Since 1960, when satellites began capturing imagery of tropical systems, only four storms have outlived Nadine.
But Nadine, still producing 65 mph sustained winds on Tuesday, isn't finished yet. It was forecast to remain at tropical storm strength through Thursday.
If it does, Nadine will beat Inez of 1966, which lasted 20.25 days, and tie Kyle of 2002, which lasted 22 days.
Tropical Storm Ginger of 1971 lasted 27 days; the 1899 storm lasted 27.75. It is unlikely that Nadine will survive that long. A frontal system is forecast to push Nadine out of its bizarre loop later this week.
Nadine grew slowly into a hurricane last month on a mostly northward course, east of Bermuda. Instead of dying, like many storms that climb into northern latitudes, Nadine kept going.
By the time Nadine reached hurricane strength it was traveling nearly due east toward Europe. It weakened into a tropical storm on Sept. 16 and then wandered southwest of the Azores until falling apart on Sept. 21.
Less than two days later, Nadine re-strengthened into a tropical storm. It regained hurricane status on Sept. 28 before dropping to tropical storm strength on Monday, southwest of the Azores. On Tuesday, the National Hurricane Center predicted it would head straight toward the islands.
Nadine's unusual loop pattern is the result of a lack of steering flow from the jet stream, Paquette said. The storm is essentially caught in an eddy, circling and maintaining its strength from warm water, moisture and lack of competing winds.
-
Comment by lonne rey on September 28, 2012 at 10:01am
-
Extreme Storm Takes Brazil From 108 to -30 and Snow!
The MetSul blog this week (translated) tells a harrowing tale of extreme heat in Brazil, followed by severe storms with hail and flooding as a powerful Spring storm system (one of the most intense ever) moved through between September 15 and 17. The temperature at Antonina, Parana, Brazil spiked to 108° F (42.1 C) before the storm hit, breaking not only winter, but summer heat records for Southern Brazil.
-
Comment by Mark on September 24, 2012 at 7:09am
-
Potentially the first new cloud formation to be recognised for 61 years:
http://www.dailymail.co.uk/news/article-2207449/Bit-grey-area-Undul...
With its turbulent swirls and brooding peaks, this is the magnificent 'undulatus asperatus,' a new species of cloud discovered by amateur sky watchers.
Now the UK-based Cloud Appreciation Society (CAS) is lobbying for it to be formally recognised by the World Meteorological Organisation in Geneva and be included in the International Cloud Atlas. The latter has not been produced since 1975.
If the CAS is successful it will be the first time a new cloud type has been officially recognised since 1951.
Meaning 'agitated wave,' the undulatus asperatus was first photographed above Cedar Rapids in Iowa, U.S. in 2006.
-----------------------------------------------------------------------------------------------------------------------------------------------------------
first observed shortly after the wobble started, most likely an effect of the disturbed wind patterns/jet stream
-
Comment by jorge namour on September 18, 2012 at 3:09pm
-
Setting the world on fire: Stunning picture of rare 'devil tornado' emerges
Mon, Sep 17, 2012An awe-struck filmmaker has told of the moment he witnessed one of nature's rarest phenomena - a fire tornado.
Chris Tangey had been out in Alice Springs, Australia, scouting locations for a new movie.
After finishing he went over to help workers at a cattle station when he was confronted by one of nature's most intimidating spectacles.
Just 300 metres away was a 30-metre high fire swirl which "sounded like a fighter jet", despite there being no wind in the area.
A fire tornado, also know as a fire devil, is caused when a column of warm, rising air comes into contact - or causes - a fire on the ground.These fire whirls are known to last for around two minutes on the very rare occasions they take place.
But Chris found himself mesmerised by the tornado for more than 40 minutes.
The 52-year-old said: "The weather was perfectly still and it was about 25 degrees celsius - it was an entirely uneventful day.
Then the next thing a man is yelling 'what the hell is that?' and I turned around and saw a 30-metre fire tornado."I was about 300 metres away and there was no wind but the tornado sounded just like a fighter jet. My jaw just dropped."
Chris, who runs Alice Springs Film and Television, in Australia, described it as a "once in ten lifetimes experience".
He added: "I've been shooting in the outback for 23 years and I have never seen anything like it. We've heard about them but they're never seen.
"If I had known what was about to happen then I would have happily paid $1,000 to watch it.
"At any time there were three different tornadoes, it just kept going and going for 40 minutes.
"The whole experience was staggering and the length and variety were astonishing."
Although they are rare, these spectacles are extremely dangerous.In 1923, a fire whirl emerged during Japan's Great Kanto Earthquake and killed 38,000 people in just 15 minutes.
http://uk.news.yahoo.com/setting-the-world-on-fire-stunning-picture...
-
-

Snow in North Iceland in early September is not unheard of but snowfall of two to three meters overnight at this time of year—when the sheep are still in highland pastures—is highly unusual.
-
Comment by SongStar101 on September 11, 2012 at 11:17am
-
In U.S., 2012 so far is hottest year on record
")
Rancher Gary Wollert pauses before heading out for work on August 23, 2012 near Eads, …
WASHINGTON (Reuters) - The first eight months of 2012 have been the warmest of any year on record in the contiguous United States, and this has been the third-hottest summer since record-keeping began in 1895, the U.S. National Climate Data Center said on Monday.
Each of the last 15 months has seen above-average temperatures, something that has never happened before in the 117 years of the U.S. record, said Jake Crouch, a climate scientist at the data center.
Winter, spring and summer 2012 have all been among the top-five hottest for their respective seasons, Crouch said by telephone, and that too is unique in the U.S. record. There has never been a warmer September-through-August period than in 2011-2012, he said.
"We're now, in terms of statistics, in unprecedented territory for how long this warm spell has continued in the contiguous U.S.," Crouch said.
He did not specify that human-spurred climate change was the cause of the record heat........
.......Alyson Kenward of the non-profit research and journalism organization Climate Central said in a statement, "Extreme heat is closely tied to climate change, and this summer's heat wave left a global warming signature in the data, particularly in the ratio of record high to record low temperatures."
Normally, the number of record highs and record lows would balance out, with an average ratio of one to one. This year, 25 states have had high to low temperature ratios of 10 to one or greater; 14 have had a ratio greater than 20 to one; and three have had greater than 40 to one ratios, Climate Central said.
Ohio topped this list with 49 record high temperatures for every record low.
DROUGHT PERVADES U.S. MIDSECTION
Last month was only the 16th warmest August on record, though still hotter than average, according to the climate data center, which is part of the National Oceanic and Atmospheric Administration.
June was also warmer than average, while July broke the all-time heat record, the data center scientists said in a statement.
It was a dry summer: as of August 28, nearly 63 percent of the Lower 48 U.S. states were experiencing drought. Still, precipitation overall was near the long-term average, with the Southwest and Southeast wetter than average and the Northwest and Northern plains drier.
The Midwest has suffered the most extreme heat, according to Climate Central, which crunches the U.S. government's weather and climate numbers.
Wisconsin, Iowa and Missouri ranked first, second and third, respectively, in terms of extreme heat in 2012, Climate Central said, followed by Indiana, Minnesota, North Dakota, Illinois and Ohio. Two states outside the Midwest - Colorado and Arkansas - rounded out the top 10.
Outside the Lower 48, the U.S. National Snow and Ice Data Center has already reported that Arctic sea ice has shrunk to a record small size, and the melting season is not over yet. The Arctic is sometimes characterized as the world's air conditioner.
As of September 5, the ice on the Arctic Ocean was less than 1.54 million square miles (4 million square km), a 45 percent reduction compared to September conditions in the 1980s and 1990s.
-
-
Up to 20 inches of rain and an 11-foot storm surge inundate Louisiana in what is now being called "more water than Katrina".
http://www.accuweather.com/en/weather-news/isaac-stats-rain-floodin...
© 2024 Created by 0nin2migqvl32.
Powered by
![]()
You need to be a member of Earth Changes and the Pole Shift to add comments!
Join Earth Changes and the Pole Shift