Wild Weather, the Wobble Effect
|
Weather: |
Tides and Whirlpools:
|
"We warned at the start of ZetaTalk, in 1995, that unpredictable weather extremes, switching about from drought to deluge, would occur and increase on a lineal basis up until the pole shift. Where this occurred steadily, it has only recently become undeniable. ZetaTalk, and only ZetaTalk, warned of these weather changes, at that early date. Our early warnings spoke to the issue of global heating from the core outward, hardly Global Warming, a surface or atmospheric issue, but caused by consternation in the core. Affected by the approach of Planet X, which was by then starting to zoom rapidly toward the inner solar system for its periodic passage, the core was churning, melting the permafrost and glaciers and riling up volcanoes. When the passage did not occur as expected in 2003 because Planet X had stalled in the inner solar system, we explained the increasing weather irregularities in the context of the global wobble that had ensued - weather wobbles where the Earth is suddenly forced under air masses, churning them. This evolved by 2005 into a looping jet stream, loops breaking away and turning like a tornado to affect the air masses underneath. Meanwhile, on Planet Earth, droughts had become more intractable and deluges positively frightening, temperature swings bringing snow in summer in the tropics and searing heat in Artic regions, with the violence of storms increasing in number and ferocity."
From the ZetaTalk Chat Q&A for February 4, 2012:
The wobble seems to have changed, as the temperature in Europe suddenly plunged after being like an early Spring, Alaska has its coldest temps ever while the US and much of Canada is having an extremely mild winter. India went from fatal cold spell to balmy again. Has the Earth changed position vs a vs Planet X to cause this? [and from another] Bitter cold records broken in Alaska - all time coldest record nearly broken, but Murphy's Law intervenes [Jan 30] http://wattsupwiththat.com/2012/01/30/bitter-cold-records-broken-in-alaska Jim River, AK closed in on the all time record coldest temperature of -80°F set in 1971, which is not only the Alaska all-time record, but the record for the entire United States. Unfortunately, it seems the battery died in the weather station just at the critical moment. While the continental USA has a mild winter and has set a number of high temperature records in the last week and pundits ponder whether they will be blaming the dreaded "global warming" for those temperatures, Alaska and Canada have been suffering through some of the coldest temperatures on record during the last week.

There has been no change in the wobble pattern, the wobble has merely become more severe. Nancy noted a Figure 8 format when the Earth wobble first became noticeable, in early 2005, after Planet X moved into the inner solar system at the end of 2003. The Figure 8 shifted along to the east a bit on the globe between 2005 and 2009, (the last time Nancy took its measure) as Planet X came closer to the Earth, encountering the magnetic N Pole with a violent push earlier in the day. But the pattern of the Figure 8 remained essentially the same. So what changed recently that the weather patterns became noticeably different in late January, 2012?
The N Pole is pushed away when it comes over the horizon, when the noon Sun is centered over the Pacific. This regularly puts Alaska under colder air, with less sunlight, and thus the historically low temps there this January, 2012 as the wobble has gotten stronger. But by the time the Sun is positioned over India, the N Pole has swung during the Figure 8 so the globe tilts, and this tilt is visible in the weather maps from Asia. The tilt has forced the globe under the hot air closer to the Equator, warming the land along a discernable tilt demarcation line.
The next loop of the Figure 8 swings the globe so that the N Pole moves in the other direction, putting the globe again at a tilt but this time in the other direction. This tilt is discernable in weather maps of Europe, again along a diagonal line. Depending upon air pressure and temperature differences, the weather on either side of this diagonal line may be suddenly warm or suddenly cold. The tilt and diagonal line lingers to affect much of the US and Canada, but the Figure 8 changes at this point to be an up and down motion, pulling the geographic N Pole south so the US is experiencing a warmer than expected winter under a stronger Sun. Then the cycle repeats, with the magnetic N Pole of Earth pushed violently away again as the Sun is positioned over the Pacific.
From the ZetaTalk Chat Q&A for April 6, 2013:
Would the Zetas be able to let us know what is causing the early break-up of the Arctic Ice, the ice seems to have taken on a swirling pattern at the same time, would this be wobble related? [and from another] http://www.vancouversun.com/news/national/Canada+Arctic+cracks+spec... The ice in Canada’s western Arctic ripped open in a massive “fracturing event” this spring that spread like a wave across 1,000 kilometres of the Beaufort Sea. Huge leads of water – some more than 500 kilometres long and as much as 70 kilometres across – opened up from Alaska to Canada’s Arctic islands as the massive ice sheet cracked as it was pushed around by strong winds and currents. It took just seven days for the fractures to progress across the entire area from west to east. [and from another] http://earthobservatory.nasa.gov/IOTD/view.php?id=80752&src=iot... A high-pressure weather system was parked over the region, producing warmer temperatures and winds that flowed in a southwesterly direction. That fueled the Beaufort Gyre, a wind-driven ocean current that flows clockwise. The gyre was the key force pulling pieces of ice west past Point Barrow, the northern nub of Alaska that protrudes into the Beaufort Sea.
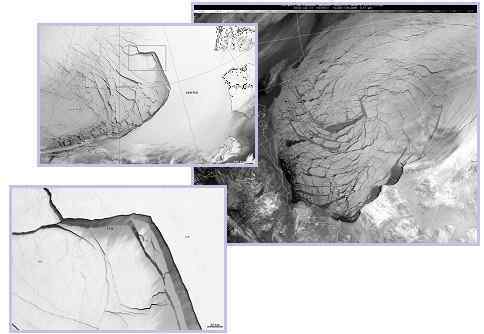
The Figure 8 formed by the N Pole during the daily Earth wobble has shifted somewhat to the East, due to Planet X positioned more to the right of the Earth during its approach. This was anticipated, and well described in ZetaTalk, the Earth crowding to the left in the cup to escape the approach of Planet X, so the angle between these two planets would change slightly. This shift of the Figure 8 to the East is due to the push against the Earth’s magnetic N Pole occurring sooner each day than prior. Thus instead of occurring when the Sun is high over the Pacific, over New Zealand, it is now occurring when the Sun is high over Alaska. All the wobble points have shifted eastward accordingly.
This has brought a lingering Winter to the western US, and a changed sloshing pattern to the Arctic waters. Instead of Pacific waters being pushed through the Bering Straits into the Arctic when the polar push occurs, the wobble is swinging the Arctic to the right, and then later to the left, creating a circular motion in the waters trapped in the Arctic. Since the Earth rotates counterclockwise, the motion also takes this path. This is yet another piece of evidence that the establishment is hard pressed to explain. They are attempting to ascribe this to high pressure and wind, all of which are not new to the Arctic, but this circular early breakup of ice in the Arctic is new.
Views: 626993
Comment
-
Comment by Howard on July 3, 2014 at 1:34am
-
2 Derechos Spawn 8 Tornadoes in Illinois and Indiana (Jun 30)
The first derecho over Iowa as of 1:45 p.m. ET June 30, 2014.
Two separate derechos affected the Chicago area Monday night resulting in eight tornadoes that touched down in the Chicago area and Northwest Indiana.
The two-fisted storm that pummeled the Chicago area this week has been classified as a rare double derecho: Two waves of destructive winds that swept across a swath of the Midwest from central Iowa to Ohio. The fast-tracking storm generated widespread wind gusts of 70-80 mph, left three quarters of a million without power, and caused two fatalities.
The first derecho formed around 2 p.m. Monday in Iowa and sped across northwest Illinois into Wisconsin over the next five hours, packing winds of more than 55 mph, according to the National Weather Service.
The second derecho also formed in Iowa, but a little more to the south and six hours later, heading almost straight east toward Chicago, the weather service said. The winds were clocked at more than 60 mph with gusts up to 70 mph.
This second wave produced eight tornadoes that touched down in northern Illinois, including one between Plainfield and Romeoville, the weather service said. No injuries were reported, but hundreds of trees were downed and nearly 200,000 customers lost power.
A derecho is a wind storm that stretches more than 240 miles and is punctuated by wind gusts of more than 55 mph. They are relatively uncommon and a double derecho is even rarer, though another one did occur here as recently as 2010, according to weather service meteorologist Ricky Castro.
What makes Monday's double derecho even stranger is that the second wave was stronger than the first. It's generally the other way around.
"Usually, the first one stabilizes the atmosphere and makes it less likely for thunderstorms to occur," Castro said. But this time, "the first derecho was less intense and the second one was violent and spawned tornadoes."
The National Weather Service said brief EF-1 tornadoes landed late Monday near Earlville, about 80 miles southwest of Chicago; near Romeoville and Plainfield in Will County; near Lisbon in rural Kendall County; three tornadoes were near Grant Park in Kankakee County. In Indiana, one tornado was confirmed in Lowell and another near DeMotte.
Sources
http://abc7chicago.com/weather/nws-8-tornadoes-confirmed-in-chicago...
http://www.chicagotribune.com/news/local/breaking/chi-onetwo-punch-...
http://www.washingtonpost.com/blogs/capital-weather-gang/wp/2014/07...
http://www.weather.com/news/derecho-and-severe-storms-cause-damage-...
-
Comment by KM on July 1, 2014 at 11:03pm
-
http://www.inthesnow.com/resorts/heavy-snow-brings-july-joy-australia/
HEAVY SNOW BRINGS JULY JOY IN AUSTRALIA
RESORTS NEWS 1 JULY 2014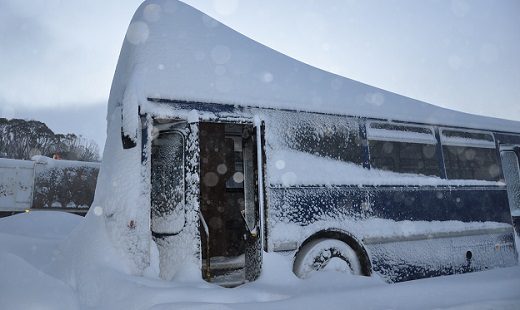
Australian ski areas – which started their season badly on June 7th with almost no snow following a record warm May, are celebrating snowfalls of up to almost five feet (1.4m in fact) during the last four days.
The snow has now stopped leaving resorts well-covered ahead of the weekend and the country’s school holiday period.
“We expect to have over 40 lifts operating for the weekend across the four resorts areas of Perisher, Smiggin Holes, Blue Cow and Guthega,” said Samantha Hales, Communications and Media Manager at Australia’s biggest resort which now has a 102.1 cm base,
“There is a lot of work to do to get the resort open after a big storm as we need to get out there and groom out the wind drift, build lift tracks and ensure the resorts is safe for guests.”
Meanwhile at Mt Hotham called the snowfall ‘Snowmageddon 1.0’ and are expecting ‘Snowmageddon 2.0’ to follow bon later this weekend,
“Snowmageddon 1.0 started last Monday and brought the snowfall we have all been waiting for. Within 3 days we had over 70cm of snow, got 6 lifts going and are looking forward to the best school holiday skiing and riding in years. Another front is coming in on Saturday and we will be hitting the 1-meter mark by Saturday night/Sunday morning,” said a statement from the resort, which currently has seven lifts running.
-
Comment by Derrick Johnson on July 1, 2014 at 7:31am
-
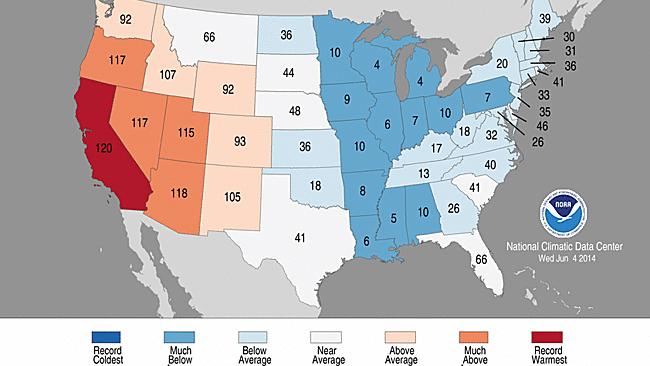
California's Record Hottest Year, So Far, Is 2014: NOAA
California is sweating through its hottest year-to-date in 2014, according to a just-released report.
 means 2014 was the hottest January-May period on record. Conversely, a ranking of 4 (Wisconsin) means the fourth coldest such period on record, dating to 1895. (NOAA/NCDC)")
Statewide temperature rankings for the period January-May 2014. A ranking of 120 (California) means 2014 was the hottest January-May period on record. Conversely, a ranking of 4 (Wisconsin) means the fourth coldest such period on record, dating to 1895. (NOAA/NCDC)
The first five months of 2014 were the hottest on record in the Golden State, according to the May U.S. State of the Climate report from NOAA's National Climatic Data Center, in records dating to 1895.
California's mean January-May temperature of 55.2 degrees was a whopping five degrees above their 20th Century average, topping the previous hottest January-May period there set in the Dust Bowl era (1934).
Los Angeles, San Francisco, San Diego, Fresno and Sacramento all set their record hottest January through May.
Persistent blocking high pressure in the upper atmosphere diverting the jet stream north of the Golden State is the primary factor behind a hot 2014, not to mention one of the worst droughts in decades.
(MORE: Record Dry 2013 | Drought Threatens Food Supply)
")
Selected cities recording their top three warmest, coldest, wettest or driest January-May in 2014. (NOAA/NCDC)
Notable Heat Elsewhere
Arizona, Oregon, Nevada and Utah also chalked up a top 10 warmest January-May period in 2014.
Las Vegas, Phoenix and Tucson have each registered their hottest year-to-date through May. The year has been among the top three hottest in Salt Lake City, Flagstaff, Arizona, and Medford, Oregon. (see red dots on inset map at right)
Impressive warmth in 2014 extended into the Last Frontier.
The year's first five months were the second warmest such period on record in Alaska, exceeded only by January-May 1981. America's northernmost city, Barrow, Alaska, has had its record warmest January-May.
Not Just the Heat
In parts of the central and eastern U.S., the first five months of 2014 were a completely different story.
Thirteen states from Minnesota to Louisiana east to Pennsylvania shivered in a top 10 coldest January-May on record (see first inset map above).
Chicago, Buffalo, Indianapolis, Toledo, Green Bay, Wisconsin, even the nation's icebox, International Falls, Minnesota chalked up a top three coldest January-May periods in 2014 (see second inset map above for more cities denoted by blue dots).
On the dry side, January through May was the second driest such period on record in Kansas, third driest in Oklahoma and fourth driest in Arizona.
Source: http://www.weather.com/news/science/california-record-hottest-year-...
-
-
Waterlogged Canadian Prairies: 150+ mm of Rain Prompts Evacuations, Local States of Emergencies (June 30)
Days of torrential downpours across parts of the Prairies have resulted in evacuations and local states of emergencies. In Saskatchewan, 53 communities have declared local states of emergency while in Manitoba, 34 municipalities have done the same.
The hardest hit areas include communities along the Saskatchewan/Manitoba border where between 100-200 mm of rain has been recorded since Friday.
Several main highways and secondary roads remain closed and officials say water also covers stretches of the Trans-Canada Highway west of Brandon, Manitoba.
Flights at Brandon's airport have also been disrupted after the facility's main access road was flooded.
Residents are being urged to delay showers, baths, and even flushing toilets to prevent additional strain on the water systems.
In addition to the flooding rains, damaging winds that whipped through Manitoba left hundreds of homes without power over the weekend.
According to hydro spokesperson Scott Powell, they've been overloaded with calls throughout southern Manitoba and the Interlake region, with power lines affected in both urban and rural areas.
Sources
http://www.theweathernetwork.com/news/articles/waterlogged-prairies...
http://www.cbc.ca/news/canada/manitoba/prairie-flooding-prompts-eva...
http://www.theweathernetwork.com/news/articles/ten-photos-flooding-...
-
-
Wild weather extremes mark USA's first half of 2014
Abandoned cars pile up in the median of I-75 near the Chattahoochee River overpass Jan. 29 in Atlanta. The interstate was covered in ice after a bad snowstorm.(Photo: David Tulis, AP)
Crazy extremes of wet and dry weather have both drenched and scorched the USA in the first half of the year.
How crazy? Waterlogged Pensacola, Fla., has received more than 200 times as much rain as bone-dry Las Vegas, which has had only one rainy day this year, Feb. 28, when about one-third of an inch fell.
Though Las Vegas is admittedly in the desert Southwest, the tiny amount is still quite paltry, about one-sixth what the city would usually get at this point in the year. Southwest hot spot Yuma, Ariz., has received less than one-tenth of an inch of rain this year.
The entire state of California — which had its warmest winter on record — slipped into drought conditions this spring, with nearly a third of the state in "exceptional" drought, the worst level. The state is enduring its worst drought since the 1970s. "Unprecedented" May wildfires scorched parts of the state.
On the flip side, torrential rain swamped the Southeast this spring, with April being the worst month. Mobile, Ala., had its wettest April ever, with a foot and a half of rain. The worst of the rain in Pensacola was in late April, when almost 2 feet fell in two days, leading to widespread flooding, sinkholes, road closures and record-high river levels.
Overall, for much of the year, the reason for the split weather pattern was a persistent ridge of high pressure over the western half of the USA, which was balanced by a trough of low pressure in the East, climate scientist Jake Crouch of the National Climatic Data Center said earlier this year.
High pressure usually brings clear skies, while low pressure brings clouds and precipitation.
Other wild weather from the year's first six months:
• A massive mudslide in Oso, Wash., in March, fueled by weeks of unusually heavy rain, killed at least 42 people, making it the third-deadliest in U.S. history.
• The brutally cold winter brought near-record levels of ice to the Great Lakes, wreaking havoc with shipping and wildlife. The ice persisted into June in Lake Superior, the latest on record.
• Detroit picked up an all-time record 7.9 feet of snow for the entire winter season of 2013-14, more than twice the city's average.
• Two inches of snow in Atlanta in late January brought the city to its knees, stranding motorists and school buses overnight. The same storm brought snow as far south as the Florida Panhandle.
• After a very quiet start to the severe weather season, a savage outbreak of tornadoes killed 33 people in the Midwest and South in late April, with the deadliest hitting Arkansas on April 27. June has also seen a flurry of tornadoes in the Plains, the most active June for tornadoes in at least four years.
• Through the end of May, Alaska was baking through its second-warmest year on record. The state had its warmest January since 1985.
Source: http://www.usatoday.com/story/weather/2014/06/27/weather-extremes/1...
-
-
http://www.thelocal.no/20140627/record-rainfall-swamps-oslo
Record rainfall swamps OsloPublished: 27 Jun 2014 12:54 GMT+02:00
Updated: 27 Jun 2014 12:54 GMT+02:00Water streamed down the city's streets on Thursday afternoon, causing gridlock in much of the city centre, while hailstorms left parts of the city covered in a layer of freak summer ice.The previous highest rainfall rate the city has seen since records began in 1937 came came in 1980, when 41.5mm of rain fell in an hour over the summer."It seems as though we had nearly one month's rainfall in three hours," Marit Helene Jensen told Aftenposten after the rain subsided yester...The Norwegian Water Resources and Energy Directorate (NVE) yesterday sent out flood warnings across eastern Norway, and on Friday were planning to send out similar warnings for the weekend to Agder, Telemark and Buskerud.The Directorate's Thomas Væringstad told NRK that meteorologists were still uncertain where the next deluge could fall.
-
-
http://www.thelocal.no/20140624/mini-tornadoes-stun-southern-norway
 The mini-tornado hovers over the Skagerrak strait. Photo: Espen Bierud
Mini-tornadoes stun southern Norway
Published: 24 Jun 2014 13:25 GMT+02:00
Updated: 24 Jun 2014 13:25 GMT+02:00"It looked like the sort of thing you'd see on an American documentary or something," Espen Bierud from Norway's Institute of Marine Research, which faces onto the sea, told The Local. "Many people standing around me said they'd never seen anything like it Norway."He said that work at the Institute had ground to a halt as the researchers made their way outside to enjoy the spectacle."It didn't take too many seconds before everyone at the Institute was down at the balcony or on the dock taking pictures," he said. "It lasted for about 20 or 30 minutes, and there were at least four different tornadoes."State Meteorologist Arild Mentzoni told Norway's NRK channel that the phenomenon, which involves a spinning mass of air sucking water off the surface of the sea, was not unheard of in Norway."It rotates so powerfully that it pulls in the water surrounding it," he told the channel. "It is not unusual that we have what we call a waterspout, but they are not often as strong as it appears in these photos."
-
-
New Data Confirms May Was Earth's Warmest on Record
Due to widespread record warmth both on land and especially at sea, May was the warmest such month on record since the instrumental record began in 1880, according to the National Oceanic and Atmospheric Administration (NOAA). The NOAA data adds to preliminary NASA data and information from the Japanese Meteorological Agency, all pointing to record warmth for the month.
This was the 39th straight May and 351st straight month with a global average surface temperature above the average for the 20th century. The last below average May occurred in 1976, and the last below average temperature for any month occurred in February 1985 (the month The Breakfast Club hit theaters).
That means that if you are under the age of 30, you have never experienced a month when global average surface temperatures were cooler than average.
Such a long streak of above average temperatures has been tied to increasing amounts of manmade greenhouse gases, such as carbon dioxide, in the atmosphere, which is causing temperatures to increase. Natural climate variability ensures that month-to-month and year-to-year trends can vary, but overall the long-term temperature trend is unmistakably upward.
The combined average temperature over global land and ocean surfaces for May 2014 was 59.93 degrees Fahrenheit, which was 1.33 degrees Fahrenheit above the 20th century average, NOAA said. The margin of error associated with this temperature is plus or minute 0.13 degrees Fahrenheit.

Global average surface temperature departures from average during May, 2014.
Image: NOAA
For the ocean, the May global sea surface temperature was 1.06 degrees Fahrenheit the 20th century average, which was the highest for May on record, surpassing the previous record- holder of 1998 by 0.04 degrees Fahrenheit. According to NOAA, this also ties with June 1998, October 2010, and July 2009 as the highest departure from average for any month on record. During May 1998, El Niño conditions were present in the Pacific, which tends to boost global average temperatures.
There is not yet an El Niño, although NOAA is predicting one will develop by the fall of this year.
Four of the five warmest Mays on record have occurred in the past five years: 2010 (second warmest), 2012 (third warmest), 2013 (fifth warmest), and 2014 (warmest), NOAA said in a report.
The majority of the world saw above average monthly temperatures during May, with record warmth across eastern Kazakhstan, parts of Indonesia, and central and northwestern Australia.
Every major ocean basin on Earth had a section that was record warm
Every major ocean basin on Earth had a section that was record warm, while the northeastern Atlantic, and the northwestern and southeastern Pacific were cooler than average. The average May temperature was record high for South Korea, at 2.2 degrees Fahrenheit above the 1981-2010 average.

Plot of global surface temperature departures from average from 1880 to the present.
Image: NOAA/NCDC
During late May, record heat affected parts of eastern Asia, with Beijing, China seeing its hottest temperature on record for the month, at 106 degrees Fahrenheit on May 30.
Studies show that heat waves are already becoming more intense and long-lasting globally, as average temperatures warm in response to increasing amounts of greenhouse gases in the air.
Source: http://mashable.com/2014/06/23/may-earths-warmest-record/
-
-
Surprise Storm Dumps Foot of Snow on Parts of the U.S. (Jun 17)
Over 14" of snow at Sperry Chalet in Glacier National Park since June 17th.
It certainly doesn't feel like summer in Montana's Glacier National Park and parts of Utah and Idaho after an unusual storm moved in, dumping up to a foot of snow.
As a point of reference, Utah typically sees an average daily temperature of 27C in June, while Montana's average June high is around 28 degrees Celcius.
The storm brought more than 100 mm of rain and 30 cm of snow to Montana's Glacier National Park.
The greater challenge will come when the heavy snowfall starts to melt, putting some areas at risk of flooding.
According to the National Weather Service in the U.S., an additional 100+ mm of rain and 20 cm of snow could fall in the mountains before the conditions dissipate this weekend.
Source
http://www.theweathernetwork.com/news/articles/surprise-storm-dumps...
-
Comment by lonne rey on June 19, 2014 at 1:07pm
-
Coldest June night in 50 years brings summertime snow
The lowest temperature since 1962 was recorded in northern Finland on Tuesday, as large swathes of the country woke up to a blanket of white. Things are forecast to warm up slightly in time for Midsummer celebrations, but the changeable weather is set to stay for the time being, with temperatures ten degrees below average for this time of year.

Snow fell during the night and in the morning in parts of Lapland, northern Ostrobothnia and central Finland. The temperature fell to zero as far south as Virrat in Pirkanmaa.
The coldest June temperature in 50 years was recorded in Saanatunturi, Northern Finland, when the mercury dropped to minus 6.2. That wasn’t quite low enough to beat the 1962 record of minus seven, measured at the start of June in Laanila, northern Lapland.
© 2024 Created by 0nin2migqvl32.
Powered by
![]()
You need to be a member of Earth Changes and the Pole Shift to add comments!
Join Earth Changes and the Pole Shift